Estimated Value: $417,000 - $441,846
4
Beds
2
Baths
2,040
Sq Ft
$210/Sq Ft
Est. Value
About This Home
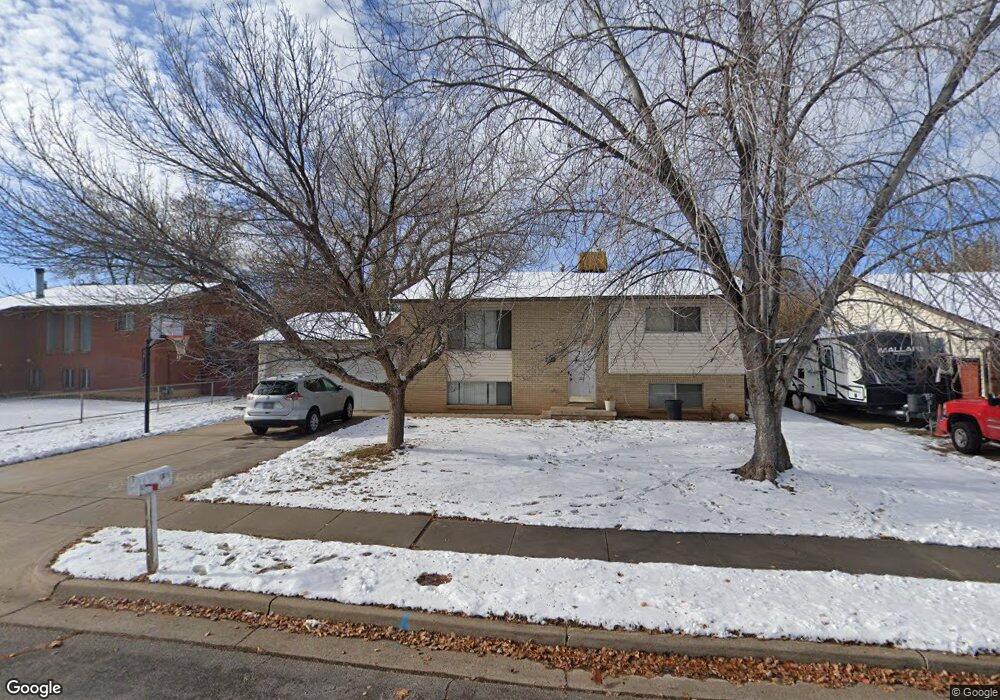
This home is located at 4823 S 3300 W, Roy, UT 84067 and is currently estimated at $428,962, approximately $210 per square foot. 4823 S 3300 W is a home located in Weber County with nearby schools including Midland School, Sand Ridge Junior High School, and Roy High School.
Ownership History
Date
Name
Owned For
Owner Type
Purchase Details
Closed on
Aug 14, 2008
Sold by
Desch Nicholas J and Desch Aimee Colleen
Bought by
Grasteit Timothy E and Grasteit Tonya R
Current Estimated Value
Home Financials for this Owner
Home Financials are based on the most recent Mortgage that was taken out on this home.
Original Mortgage
$163,012
Outstanding Balance
$106,937
Interest Rate
6.32%
Mortgage Type
FHA
Estimated Equity
$322,025
Purchase Details
Closed on
Feb 5, 2007
Sold by
Branz Justin Cody and Branz Christi L
Bought by
Desch Nicholas J and Desch Aimee Colleen
Home Financials for this Owner
Home Financials are based on the most recent Mortgage that was taken out on this home.
Original Mortgage
$153,000
Interest Rate
6.11%
Mortgage Type
VA
Purchase Details
Closed on
Nov 20, 1998
Sold by
Parker Wayne C and Parker Julie Ann
Bought by
Branz Justin Cody and Branz Christi L
Home Financials for this Owner
Home Financials are based on the most recent Mortgage that was taken out on this home.
Original Mortgage
$105,133
Interest Rate
6.42%
Mortgage Type
FHA
Create a Home Valuation Report for This Property
The Home Valuation Report is an in-depth analysis detailing your home's value as well as a comparison with similar homes in the area
Home Values in the Area
Average Home Value in this Area
Purchase History
| Date | Buyer | Sale Price | Title Company |
|---|---|---|---|
| Grasteit Timothy E | -- | Lincoln Title Ins Agency | |
| Desch Nicholas J | -- | First American Title Legend | |
| Branz Justin Cody | -- | Bonneville Title Company |
Source: Public Records
Mortgage History
| Date | Status | Borrower | Loan Amount |
|---|---|---|---|
| Open | Grasteit Timothy E | $163,012 | |
| Previous Owner | Desch Nicholas J | $153,000 | |
| Previous Owner | Branz Justin Cody | $105,133 |
Source: Public Records
Tax History Compared to Growth
Tax History
| Year | Tax Paid | Tax Assessment Tax Assessment Total Assessment is a certain percentage of the fair market value that is determined by local assessors to be the total taxable value of land and additions on the property. | Land | Improvement |
|---|---|---|---|---|
| 2025 | $2,628 | $416,863 | $135,000 | $281,863 |
| 2024 | $2,566 | $225,499 | $74,256 | $151,243 |
| 2023 | $2,352 | $205,700 | $65,864 | $139,836 |
| 2022 | $2,528 | $229,350 | $60,501 | $168,849 |
| 2021 | $1,998 | $296,000 | $79,963 | $216,037 |
| 2020 | $1,941 | $265,000 | $79,963 | $185,037 |
| 2019 | $1,904 | $245,000 | $44,976 | $200,024 |
| 2018 | $1,788 | $216,000 | $40,002 | $175,998 |
| 2017 | $1,580 | $177,000 | $40,002 | $136,998 |
| 2016 | $1,557 | $94,008 | $21,944 | $72,064 |
| 2015 | $1,373 | $84,032 | $21,944 | $62,088 |
| 2014 | $1,377 | $83,523 | $21,944 | $61,579 |
Source: Public Records
Map
Nearby Homes
- 3295 W 4850 S
- 3171 W 4725 S
- 3524 W 4835 S Unit 22
- 3523 W 4835 S Unit 28
- 3184 W 5025 S
- 4510 Stone Creek Rd Unit F
- 2090 W 1625 S Unit 101
- 4666 S 3600 W
- Poplar Plan at Highgate Cove
- Pando Plan at Highgate Cove
- 4491 Haven Creek Rd Unit A
- 3434 W 4525 S
- 3627 W 4650 S
- 3632 W 4650 S
- 3651 W 4625 S
- 3671 W 4700 S
- 3679 W 4700 S
- 4440 Stone Creek Rd Unit 2E
- 3669 W 4625 S
- 3443 W 5200 S Unit 2&3