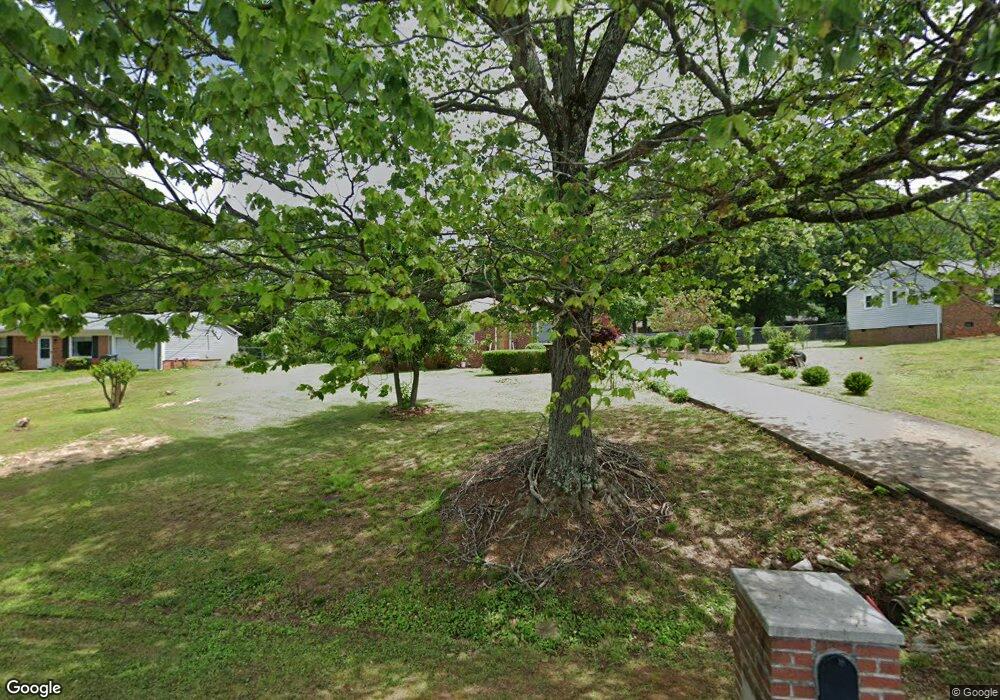
4823 Thornbrook Ln Winston Salem, NC 27105
Estimated Value: $151,000 - $199,000
3
Beds
2
Baths
1,204
Sq Ft
$143/Sq Ft
Est. Value
About This Home
This home is located at 4823 Thornbrook Ln, Winston Salem, NC 27105 and is currently estimated at $171,666, approximately $142 per square foot. 4823 Thornbrook Ln is a home located in Forsyth County with nearby schools including Ibraham Elementary School, Walkertown Middle, and Carver High.
Ownership History
Date
Name
Owned For
Owner Type
Purchase Details
Closed on
Dec 14, 2021
Sold by
Martinez Maria
Bought by
Martinez Karla Patricia Cor
Current Estimated Value
Home Financials for this Owner
Home Financials are based on the most recent Mortgage that was taken out on this home.
Original Mortgage
$96,800
Outstanding Balance
$88,823
Interest Rate
3.09%
Mortgage Type
New Conventional
Estimated Equity
$82,843
Purchase Details
Closed on
Aug 23, 2021
Sold by
Anceilmo Benitez Jose Pilar
Bought by
Martinez Maria
Purchase Details
Closed on
Dec 21, 2007
Sold by
Franks Phyllis and Franks Marion
Bought by
Martinez Maria and Ancelmo Benitez Jose Pilar
Home Financials for this Owner
Home Financials are based on the most recent Mortgage that was taken out on this home.
Original Mortgage
$71,167
Interest Rate
6.17%
Mortgage Type
Purchase Money Mortgage
Create a Home Valuation Report for This Property
The Home Valuation Report is an in-depth analysis detailing your home's value as well as a comparison with similar homes in the area
Home Values in the Area
Average Home Value in this Area
Purchase History
| Date | Buyer | Sale Price | Title Company |
|---|---|---|---|
| Martinez Karla Patricia Cor | $121,000 | None Listed On Document | |
| Martinez Maria | -- | None Available | |
| Martinez Maria | $90,000 | None Available |
Source: Public Records
Mortgage History
| Date | Status | Borrower | Loan Amount |
|---|---|---|---|
| Open | Martinez Karla Patricia Cor | $96,800 | |
| Previous Owner | Martinez Maria | $71,167 |
Source: Public Records
Tax History Compared to Growth
Tax History
| Year | Tax Paid | Tax Assessment Tax Assessment Total Assessment is a certain percentage of the fair market value that is determined by local assessors to be the total taxable value of land and additions on the property. | Land | Improvement |
|---|---|---|---|---|
| 2025 | $682 | $182,800 | $31,000 | $151,800 |
| 2024 | $682 | $85,100 | $22,000 | $63,100 |
| 2023 | $682 | $85,100 | $22,000 | $63,100 |
| 2022 | $678 | $85,100 | $22,000 | $63,100 |
| 2021 | $678 | $85,100 | $22,000 | $63,100 |
| 2020 | $539 | $62,300 | $15,800 | $46,500 |
| 2019 | $546 | $62,300 | $15,800 | $46,500 |
| 2018 | $518 | $62,300 | $15,800 | $46,500 |
| 2016 | $502 | $59,967 | $15,000 | $44,967 |
| 2015 | $534 | $59,967 | $15,000 | $44,967 |
| 2014 | $526 | $59,967 | $15,000 | $44,967 |
Source: Public Records
Map
Nearby Homes
- 4870 Dippen Rd
- 4847 Dippen Rd
- 4965 Davis Rd
- 4957 Davis Rd
- 0 Oakdale Dr
- 4980 Davis Rd
- 4944 Davis Rd
- 0 Old Walkertown Rd
- 3529 Day Rd
- 4513 Northampton Dr
- 5012 Sitka Rd
- 5084 Dippen Rd
- 0 Northwest Dr
- 5029 Fletcher Dr
- 400 Torey Pines Ct
- 4410 Winnabow Rd
- 1952 Old Hollow Rd
- 5149 Alaska Rd
- 4601 Oak Ridge Dr
- 4913 Day Ct
- 4819 Thornbrook Ln
- 4827 Thornbrook Ln
- 4864 Dippen Rd
- 4815 Thornbrook Ln
- 4831 Thornbrook Ln
- 4858 Dippen Rd
- 4830 Thornbrook Ln
- 4876 Dippen Rd
- 4820 Thornbrook Ln
- 4852 Dippen Rd
- 4835 Thornbrook Ln
- 4809 Thornbrook Ln
- 4816 Thornbrook Ln
- 4882 Dippen Rd
- 5036 Kaybrook Dr
- 4846 Dippen Rd
- 4812 Thornbrook Ln
- 4836 Thornbrook Ln
- 4888 Dippen Rd
- 4839 Thornbrook Ln