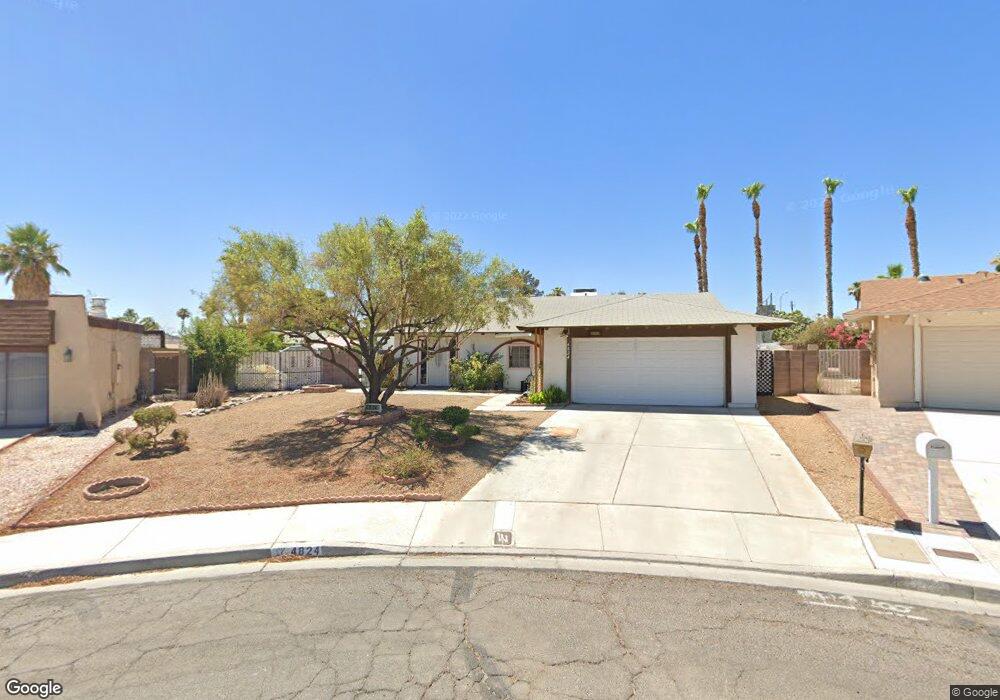
4824 Aveneda Sandia Las Vegas, NV 89121
Paradise Valley East NeighborhoodEstimated Value: $352,000 - $426,000
3
Beds
2
Baths
1,306
Sq Ft
$302/Sq Ft
Est. Value
About This Home
This home is located at 4824 Aveneda Sandia, Las Vegas, NV 89121 and is currently estimated at $394,865, approximately $302 per square foot. 4824 Aveneda Sandia is a home located in Clark County with nearby schools including William E. Ferron Elementary School, C.W. Woodbury Middle School, and Chaparral High School.
Ownership History
Date
Name
Owned For
Owner Type
Purchase Details
Closed on
Jan 25, 2016
Sold by
Vana Chariya
Bought by
Nilawat Rutana
Current Estimated Value
Purchase Details
Closed on
Jan 4, 2012
Sold by
Bunsongsikul Supawan
Bought by
Vana Chariya
Purchase Details
Closed on
Dec 30, 2009
Sold by
Chomsavee Narin and Nilawat Rutana
Bought by
Bunsongsikul Supawan
Purchase Details
Closed on
Dec 15, 2009
Sold by
Bunsongsikul Chatchai
Bought by
Bunsongsikul Supawan
Purchase Details
Closed on
Jan 12, 2006
Sold by
Collins Andrew
Bought by
Chomsavee Narin and Nilawat Rutana
Home Financials for this Owner
Home Financials are based on the most recent Mortgage that was taken out on this home.
Original Mortgage
$230,000
Interest Rate
6.16%
Mortgage Type
Fannie Mae Freddie Mac
Purchase Details
Closed on
Jun 1, 2005
Sold by
Wallace Wesley L
Bought by
Wallace Wesley and The Wesley Wallace Revocable Living Tr
Create a Home Valuation Report for This Property
The Home Valuation Report is an in-depth analysis detailing your home's value as well as a comparison with similar homes in the area
Home Values in the Area
Average Home Value in this Area
Purchase History
| Date | Buyer | Sale Price | Title Company |
|---|---|---|---|
| Nilawat Rutana | $65,000 | None Available | |
| Vana Chariya | $60,000 | None Available | |
| Bunsongsikul Supawan | $100,000 | Lawyers Title Of Nevada Mid | |
| Bunsongsikul Supawan | $100,000 | Lawyers Title Of Nevada Mid | |
| Chomsavee Narin | $287,500 | Chicago Title | |
| Wallace Wesley | -- | -- |
Source: Public Records
Mortgage History
| Date | Status | Borrower | Loan Amount |
|---|---|---|---|
| Previous Owner | Chomsavee Narin | $230,000 |
Source: Public Records
Tax History Compared to Growth
Tax History
| Year | Tax Paid | Tax Assessment Tax Assessment Total Assessment is a certain percentage of the fair market value that is determined by local assessors to be the total taxable value of land and additions on the property. | Land | Improvement |
|---|---|---|---|---|
| 2025 | $1,546 | $65,358 | $34,545 | $30,813 |
| 2024 | $1,432 | $65,358 | $34,545 | $30,813 |
| 2023 | $954 | $64,728 | $33,950 | $30,778 |
| 2022 | $1,326 | $54,721 | $25,550 | $29,171 |
| 2021 | $1,228 | $53,895 | $25,550 | $28,345 |
| 2020 | $1,138 | $49,860 | $21,000 | $28,860 |
| 2019 | $1,066 | $45,850 | $16,800 | $29,050 |
| 2018 | $1,017 | $45,130 | $16,450 | $28,680 |
| 2017 | $1,291 | $44,018 | $14,350 | $29,668 |
| 2016 | $954 | $41,815 | $11,200 | $30,615 |
| 2015 | $951 | $39,285 | $9,100 | $30,185 |
| 2014 | $921 | $30,468 | $7,000 | $23,468 |
Source: Public Records
Map
Nearby Homes
- 3831 Calle de Benito
- 3917 Acapulco Ave
- 3961 Acapulco Ave
- 3982 Acapulco Ave
- 3994 Ridgewood Ave
- 3690 La Junta Dr
- 3695 Garita Ct
- 3955 Ventura Way
- 4010 Syracuse Dr
- 4990 Spring Oak St Unit 4
- 3912 Ventura Way
- 5028 Meadow Grove Ct
- 4095 Ridgewood Ave
- 3999 Meadow Grove Ave
- 3646 Billman Ave
- 5102 Tennis Ct E
- 5141 Shadow Hill Dr
- 4485 Greenhill Dr
- 4129 Ridgewood Ave
- 4161 Oxnard Cir
- 4816 Aveneda Sandia
- 3832 Calle de Benito
- 3842 Calle de Benito
- 4832 Aveneda Sandia
- 3822 Calle de Benito
- 3852 Calle de Benito Unit 1
- 3865 Vista Largo Dr
- 3857 Vista Largo Dr
- 4823 Aveneda Sandia
- 3812 Calle de Benito
- 3873 Vista Largo Dr
- 3862 Calle de Benito
- 4815 Aveneda Sandia
- 3881 Vista Largo Dr
- 3841 Calle de Benito
- 3821 Calle de Benito
- 3851 Calle de Benito
- 3872 Calle de Benito
- 3889 Vista Largo Dr
- 3833 Vista Largo Dr