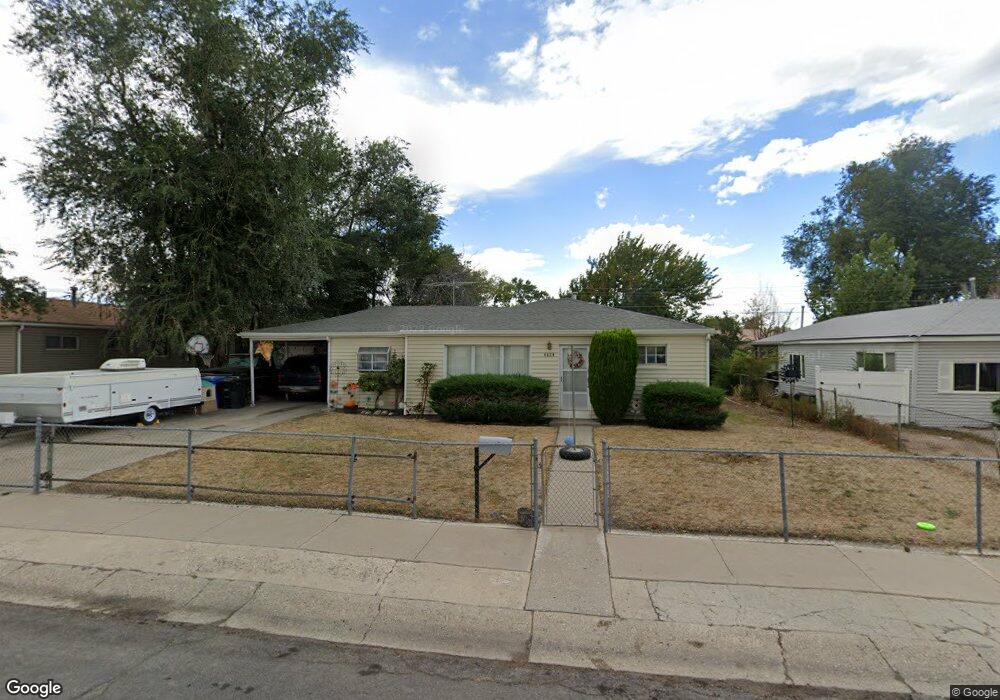
4824 S 4340 W Salt Lake City, UT 84118
Estimated Value: $365,000 - $401,000
3
Beds
2
Baths
1,180
Sq Ft
$326/Sq Ft
Est. Value
About This Home
This home is located at 4824 S 4340 W, Salt Lake City, UT 84118 and is currently estimated at $384,426, approximately $325 per square foot. 4824 S 4340 W is a home located in Salt Lake County with nearby schools including David Gourley Elementary School, Kearns Jr High School, and Kearns High School.
Ownership History
Date
Name
Owned For
Owner Type
Purchase Details
Closed on
Dec 29, 1995
Sold by
Martinez Moses Robert and Martinez Stella Theresa
Bought by
Lund Shon R and Lund Patricia A
Current Estimated Value
Home Financials for this Owner
Home Financials are based on the most recent Mortgage that was taken out on this home.
Original Mortgage
$71,250
Outstanding Balance
$1,936
Interest Rate
7.36%
Estimated Equity
$382,490
Create a Home Valuation Report for This Property
The Home Valuation Report is an in-depth analysis detailing your home's value as well as a comparison with similar homes in the area
Home Values in the Area
Average Home Value in this Area
Purchase History
| Date | Buyer | Sale Price | Title Company |
|---|---|---|---|
| Lund Shon R | -- | Old Republic Title Co Of Uta |
Source: Public Records
Mortgage History
| Date | Status | Borrower | Loan Amount |
|---|---|---|---|
| Open | Lund Shon R | $71,250 |
Source: Public Records
Tax History Compared to Growth
Tax History
| Year | Tax Paid | Tax Assessment Tax Assessment Total Assessment is a certain percentage of the fair market value that is determined by local assessors to be the total taxable value of land and additions on the property. | Land | Improvement |
|---|---|---|---|---|
| 2025 | $2,590 | $338,100 | $88,200 | $249,900 |
| 2024 | $2,590 | $322,500 | $82,800 | $239,700 |
| 2023 | $2,473 | $287,900 | $79,600 | $208,300 |
| 2022 | $2,253 | $299,200 | $78,100 | $221,100 |
| 2021 | $2,295 | $248,200 | $60,100 | $188,100 |
| 2020 | $1,899 | $207,200 | $54,700 | $152,500 |
| 2019 | $1,949 | $204,300 | $51,600 | $152,700 |
| 2018 | $1,737 | $186,300 | $51,600 | $134,700 |
| 2017 | $1,441 | $161,800 | $51,600 | $110,200 |
| 2016 | $1,316 | $137,000 | $47,600 | $89,400 |
| 2015 | $1,065 | $111,500 | $58,000 | $53,500 |
| 2014 | $994 | $101,800 | $53,900 | $47,900 |
Source: Public Records
Map
Nearby Homes