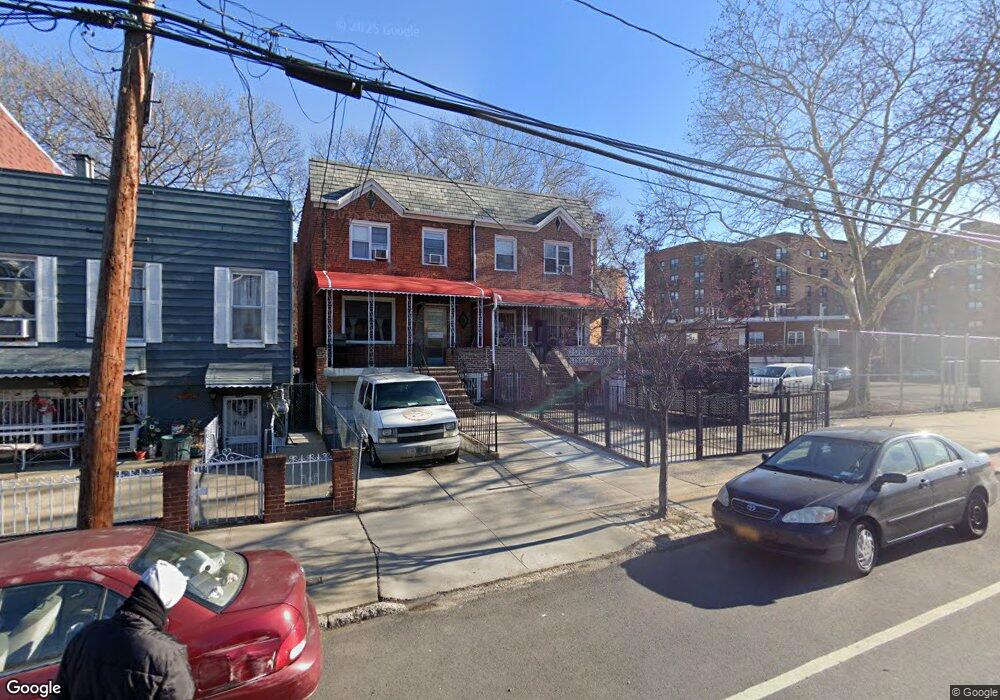
4825 39th St Sunnyside, NY 11104
Sunnyside NeighborhoodEstimated Value: $1,043,000 - $1,292,000
--
Bed
--
Bath
1,750
Sq Ft
$659/Sq Ft
Est. Value
About This Home
This home is located at 4825 39th St, Sunnyside, NY 11104 and is currently estimated at $1,152,931, approximately $658 per square foot. 4825 39th St is a home located in Queens County with nearby schools including P.S. 199 Maurice A Fitzgerald, Long Island City High School, and Most Precious Blood Roman Catholic Church.
Ownership History
Date
Name
Owned For
Owner Type
Purchase Details
Closed on
Jan 31, 1996
Sold by
Shannon Mary Maureen
Bought by
Li Shing Kung and Tam Yee Nor
Current Estimated Value
Home Financials for this Owner
Home Financials are based on the most recent Mortgage that was taken out on this home.
Original Mortgage
$121,000
Outstanding Balance
$3,963
Interest Rate
7.02%
Estimated Equity
$1,148,968
Create a Home Valuation Report for This Property
The Home Valuation Report is an in-depth analysis detailing your home's value as well as a comparison with similar homes in the area
Home Values in the Area
Average Home Value in this Area
Purchase History
| Date | Buyer | Sale Price | Title Company |
|---|---|---|---|
| Li Shing Kung | $171,000 | Commonwealth Land Title Ins |
Source: Public Records
Mortgage History
| Date | Status | Borrower | Loan Amount |
|---|---|---|---|
| Open | Li Shing Kung | $121,000 |
Source: Public Records
Tax History Compared to Growth
Tax History
| Year | Tax Paid | Tax Assessment Tax Assessment Total Assessment is a certain percentage of the fair market value that is determined by local assessors to be the total taxable value of land and additions on the property. | Land | Improvement |
|---|---|---|---|---|
| 2025 | $7,972 | $40,808 | $5,845 | $34,963 |
| 2024 | $7,972 | $39,691 | $6,487 | $33,204 |
| 2023 | $7,972 | $39,691 | $5,884 | $33,807 |
| 2022 | $7,627 | $71,880 | $10,140 | $61,740 |
| 2021 | $7,586 | $62,220 | $10,140 | $52,080 |
| 2020 | $7,198 | $63,960 | $10,140 | $53,820 |
| 2019 | $6,919 | $57,120 | $10,140 | $46,980 |
| 2018 | $6,743 | $33,076 | $6,432 | $26,644 |
| 2017 | $3,308 | $31,839 | $6,811 | $25,028 |
| 2016 | $6,005 | $31,839 | $6,811 | $25,028 |
| 2015 | $3,403 | $28,339 | $7,441 | $20,898 |
| 2014 | $3,403 | $27,564 | $8,495 | $19,069 |
Source: Public Records
Map
Nearby Homes
- 5024 39th Place
- 50-21 39th Place Unit 2C
- 50-21 39th Place Unit 6D
- 0 39th St
- 50-22 40th St Unit 3E
- 50-22 40th St Unit 5A
- 50-35 38th St
- 3617 Greenpoint Ave
- 48-12 37th St
- 50-43 39th St
- 50-29 39th Place
- 4827 40th St
- 48-21 40th St Unit 2C
- 48-21 40th St Unit 5H
- 50-21 40th St
- 5054 39th Place
- 47-25 40th St Unit 2C
- 48-23 42nd St Unit 1 J
- 48-17 42nd St Unit 2C
- 48-17 42nd St Unit 7B
- 4823 39th St
- 4821 39th St
- 48-21 39th St Unit 2R
- 48-21 39th St Unit 2FL
- 4821 39th St Unit BASEMT
- 4819 39th St
- 48-19 39th St
- 48-15 Greenpoint Ave
- 48-11 Greenpoint Ave
- 4817 39th St
- 4815 39th St
- 3952 Greenpoint Ave
- 4813 39th St Unit 2
- 4813 39th St
- 39-17 Greenpoint Ave Unit 2L
- 39-17 Greenpoint Ave Unit 2R
- 39-17 Greenpoint Ave
- 3921 Greenpoint Ave
- 39-21 Greenpoint Ave
- 39-19 Greenpoint Ave