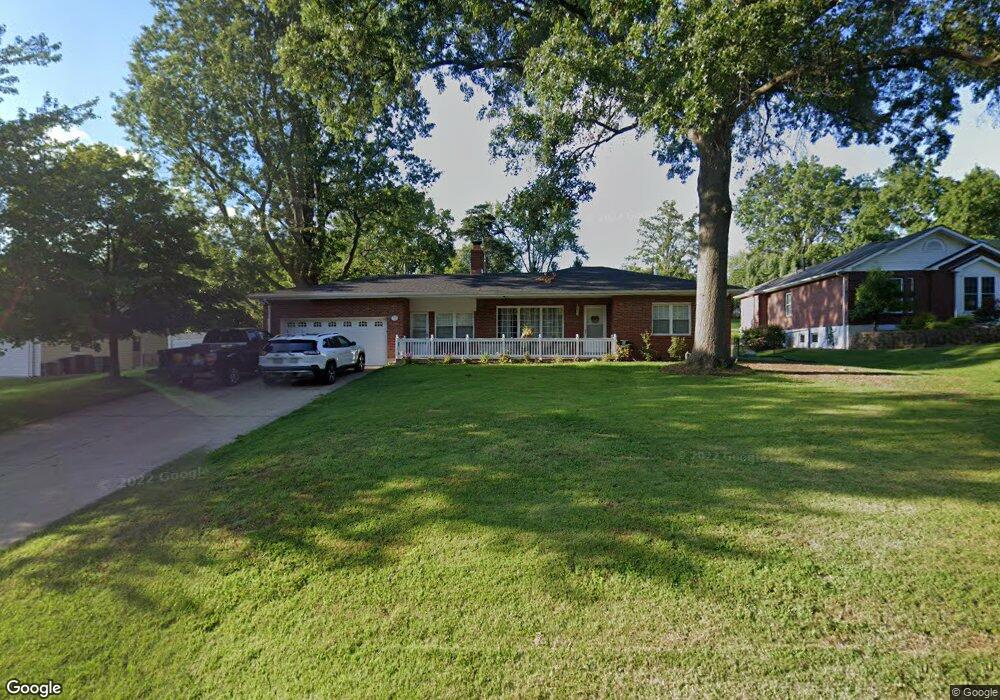
4825 E Concord Rd Saint Louis, MO 63128
Estimated Value: $302,041 - $408,000
2
Beds
1
Bath
1,252
Sq Ft
$272/Sq Ft
Est. Value
About This Home
This home is located at 4825 E Concord Rd, Saint Louis, MO 63128 and is currently estimated at $340,260, approximately $271 per square foot. 4825 E Concord Rd is a home located in St. Louis County with nearby schools including Sappington Elementary School, Sperreng Middle School, and Lindbergh High School.
Ownership History
Date
Name
Owned For
Owner Type
Purchase Details
Closed on
Jul 31, 2019
Sold by
Merkel Patricia K and Patricia K Merkel Revocable Li
Bought by
Reeves Jeffrey and Reeves Michelle
Current Estimated Value
Home Financials for this Owner
Home Financials are based on the most recent Mortgage that was taken out on this home.
Original Mortgage
$169,200
Outstanding Balance
$140,858
Interest Rate
3.8%
Mortgage Type
New Conventional
Estimated Equity
$199,402
Purchase Details
Closed on
Aug 13, 2013
Sold by
Merkel Patricia K
Bought by
Merkel Patricia K and The Patricia K Merkel Revocable Living T
Purchase Details
Closed on
Jan 18, 2000
Sold by
Merkel Dale A and Merkel Patricia K
Bought by
Merkel Douglas Dale and Merkel Pamela Kay
Purchase Details
Closed on
Aug 8, 1997
Sold by
Dale Geren Ora and Osmun Mary
Bought by
Merkel Dale A and Merkel Patricia K
Create a Home Valuation Report for This Property
The Home Valuation Report is an in-depth analysis detailing your home's value as well as a comparison with similar homes in the area
Home Values in the Area
Average Home Value in this Area
Purchase History
| Date | Buyer | Sale Price | Title Company |
|---|---|---|---|
| Reeves Jeffrey | $211,500 | Title Partners Agency Llc | |
| Merkel Patricia K | -- | None Available | |
| Merkel Douglas Dale | -- | -- | |
| Merkel Dale A | -- | -- |
Source: Public Records
Mortgage History
| Date | Status | Borrower | Loan Amount |
|---|---|---|---|
| Open | Reeves Jeffrey | $169,200 |
Source: Public Records
Tax History
| Year | Tax Paid | Tax Assessment Tax Assessment Total Assessment is a certain percentage of the fair market value that is determined by local assessors to be the total taxable value of land and additions on the property. | Land | Improvement |
|---|---|---|---|---|
| 2025 | $3,113 | $55,120 | $23,090 | $32,030 |
| 2024 | $3,113 | $47,770 | $21,170 | $26,600 |
| 2023 | $3,106 | $47,770 | $21,170 | $26,600 |
| 2022 | $2,789 | $41,120 | $19,250 | $21,870 |
| 2021 | $2,690 | $41,120 | $19,250 | $21,870 |
| 2020 | $2,719 | $40,120 | $16,070 | $24,050 |
| 2019 | $2,713 | $40,120 | $16,070 | $24,050 |
| 2018 | $2,337 | $31,390 | $9,940 | $21,450 |
| 2016 | $2,177 | $28,050 | $9,940 | $18,110 |
Source: Public Records
Map
Nearby Homes
- 5019 Valley Crest Ct
- 4829 Gatesbury Dr
- 11345 Revere Ln
- 4931 Theiss Rd
- 12055 Charwick Dr
- 4515 von Talge Meadows Ct
- 4930 Mount Royal Rd
- 11542 Concord Village Ave
- 11143 Yuma Place
- 10005 Sakura Dr Unit D
- 11951 Tesson Ferry Rd Unit D
- 11214 Behr Dr
- 10041 Sakura Dr
- 10008 Meadowfield Ln
- 10032 Sakura Dr
- 10070 Sakura Dr Unit 100070
- 4501 Eli Dr Unit K
- 4501 Eli Dr Unit I
- 10714 Winthrop Ct
- 10117 Sakura Dr Unit F
- 4829 E Concord Rd
- 4821 E Concord Rd
- 53 Dorclin Ln
- 4824 E Concord Rd
- 4833 E Concord Rd
- 55 Dorclin Ln
- 51 Dorclin Ln
- 4836 E Concord Rd
- 4 Dorclin Ln
- 4144 Jamie Dr
- 4818 E Concord Rd
- 4136 Jamie Dr
- 1 Fawnwood Dr
- 47 Dorclin Ln
- 1 Dorclin Ln
- 4202 Valley Crest Hills Dr
- 3 Dorclin Ln
- 4130 Jamie Dr
- 48 Dorclin Ln
- 4749 E Concord Rd
Your Personal Tour Guide
Ask me questions while you tour the home.