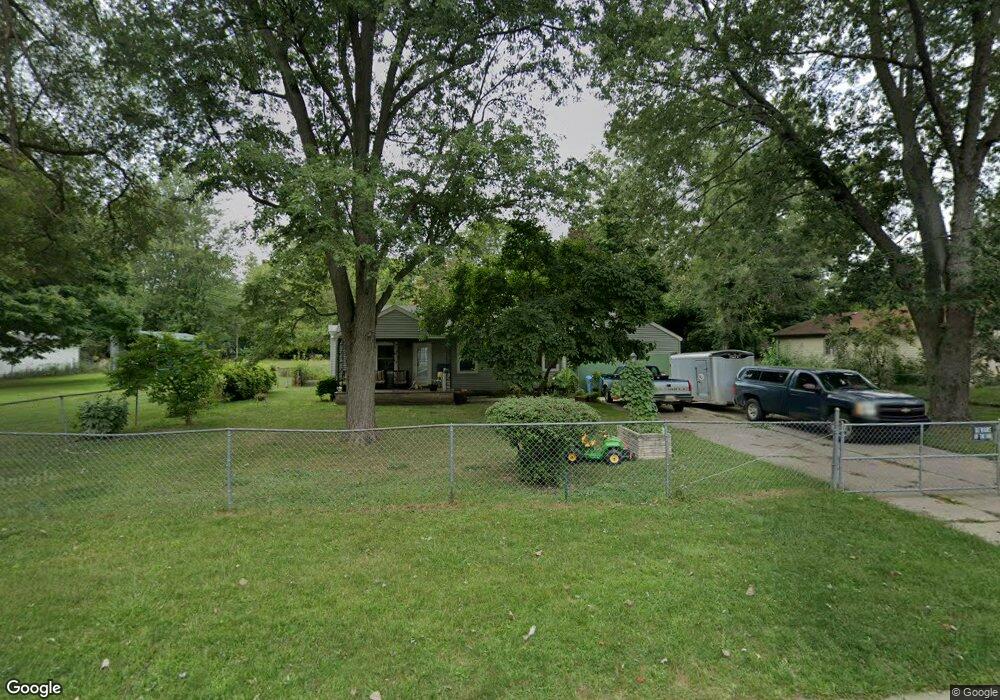
4826 Sidney St Lansing, MI 48911
Pleasant Grove NeighborhoodEstimated Value: $123,000 - $147,000
Studio
--
Bath
1,066
Sq Ft
$124/Sq Ft
Est. Value
About This Home
This home is located at 4826 Sidney St, Lansing, MI 48911 and is currently estimated at $132,172, approximately $123 per square foot. 4826 Sidney St is a home located in Ingham County with nearby schools including Reo Elementary School, Attwood School, and Everett High School.
Ownership History
Date
Name
Owned For
Owner Type
Purchase Details
Closed on
Jun 5, 2000
Sold by
The Cit Group/Consumer Finance Inc
Bought by
Morofsky Donald S
Current Estimated Value
Home Financials for this Owner
Home Financials are based on the most recent Mortgage that was taken out on this home.
Original Mortgage
$36,680
Interest Rate
8.64%
Mortgage Type
Balloon
Purchase Details
Closed on
May 21, 1999
Sold by
Johnson Sandra K and Johnson James L
Bought by
The Cit Group
Purchase Details
Closed on
Dec 16, 1998
Sold by
Henry Clanford
Bought by
Johnson James and Johnson Sandra
Purchase Details
Closed on
Nov 1, 1992
Create a Home Valuation Report for This Property
The Home Valuation Report is an in-depth analysis detailing your home's value as well as a comparison with similar homes in the area
Home Values in the Area
Average Home Value in this Area
Purchase History
| Date | Buyer | Sale Price | Title Company |
|---|---|---|---|
| Morofsky Donald S | $48,907 | First American Title Ins Co | |
| The Cit Group | $48,591 | -- | |
| Johnson James | $49,900 | -- | |
| -- | $35,200 | -- |
Source: Public Records
Mortgage History
| Date | Status | Borrower | Loan Amount |
|---|---|---|---|
| Closed | Morofsky Donald S | $36,680 |
Source: Public Records
Tax History
| Year | Tax Paid | Tax Assessment Tax Assessment Total Assessment is a certain percentage of the fair market value that is determined by local assessors to be the total taxable value of land and additions on the property. | Land | Improvement |
|---|---|---|---|---|
| 2025 | $2,187 | $66,600 | $20,400 | $46,200 |
| 2024 | $17 | $57,800 | $20,400 | $37,400 |
| 2023 | $2,052 | $50,800 | $20,400 | $30,400 |
| 2022 | $1,853 | $42,500 | $14,300 | $28,200 |
| 2021 | $1,814 | $37,100 | $10,600 | $26,500 |
| 2020 | $1,803 | $34,000 | $10,600 | $23,400 |
| 2019 | $3,011 | $32,600 | $10,600 | $22,000 |
| 2018 | $1,620 | $28,400 | $10,600 | $17,800 |
| 2017 | $1,550 | $28,400 | $10,600 | $17,800 |
| 2016 | $1,823 | $27,100 | $10,600 | $16,500 |
| 2015 | $1,823 | $26,200 | $21,132 | $5,068 |
| 2014 | $1,823 | $28,000 | $27,347 | $653 |
Source: Public Records
Map
Nearby Homes
- 2706 W Jolly Rd
- 2416 Midwood St
- 2820 Reo Rd
- 2918 Midwood St
- 2807 W Jolly Rd
- 4927 Starr Ave
- 4928 Hughes Rd
- 4416 Ballard Rd
- 1941 Reo Rd
- 3214 Raynell St
- 5017 Christiansen Rd
- 0 Midwood St
- 2105 Mary Ave
- 1808 W Jolly Rd
- 1729 Reo Rd
- 3907 Ingham St
- 0 Ingham St
- 3428 W Jolly Rd
- 5129 Wexford Rd
- 1904 Hillcrest St
Your Personal Tour Guide
Ask me questions while you tour the home.