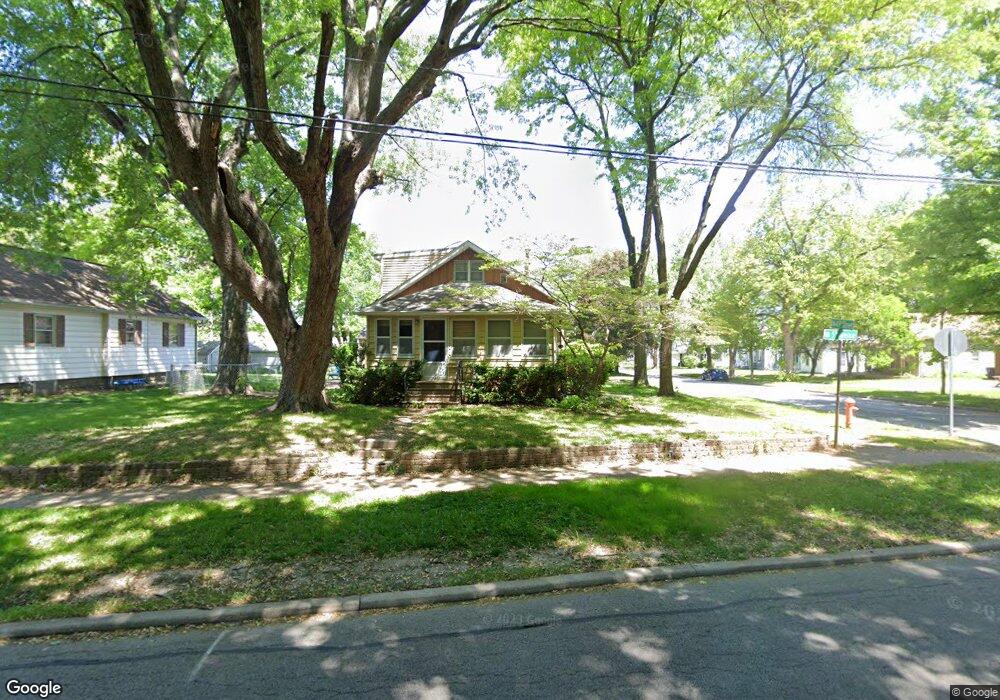
4827 5th Ave Moline, IL 61265
East End NeighborhoodEstimated Value: $123,000 - $158,000
3
Beds
2
Baths
1,413
Sq Ft
$96/Sq Ft
Est. Value
About This Home
This home is located at 4827 5th Ave, Moline, IL 61265 and is currently estimated at $135,949, approximately $96 per square foot. 4827 5th Ave is a home located in Rock Island County with nearby schools including Benjamin Franklin Elementary School, Woodrow Wilson Middle School, and Moline Sr High School.
Ownership History
Date
Name
Owned For
Owner Type
Purchase Details
Closed on
Jul 25, 2012
Sold by
Mckinley Thomas O and Mckinley Kathleen
Bought by
Mckinley Thomas O and Mckinley Kathleen
Current Estimated Value
Home Financials for this Owner
Home Financials are based on the most recent Mortgage that was taken out on this home.
Original Mortgage
$83,186
Outstanding Balance
$57,368
Interest Rate
3.65%
Mortgage Type
FHA
Estimated Equity
$78,581
Create a Home Valuation Report for This Property
The Home Valuation Report is an in-depth analysis detailing your home's value as well as a comparison with similar homes in the area
Home Values in the Area
Average Home Value in this Area
Purchase History
| Date | Buyer | Sale Price | Title Company |
|---|---|---|---|
| Mckinley Thomas O | -- | Custom Recording Solutions |
Source: Public Records
Mortgage History
| Date | Status | Borrower | Loan Amount |
|---|---|---|---|
| Open | Mckinley Thomas O | $83,186 |
Source: Public Records
Tax History
| Year | Tax Paid | Tax Assessment Tax Assessment Total Assessment is a certain percentage of the fair market value that is determined by local assessors to be the total taxable value of land and additions on the property. | Land | Improvement |
|---|---|---|---|---|
| 2024 | $2,878 | $38,619 | $3,919 | $34,700 |
| 2023 | $2,523 | $34,005 | $3,747 | $30,258 |
| 2022 | $2,523 | $34,005 | $3,747 | $30,258 |
| 2021 | $2,514 | $32,479 | $3,579 | $28,900 |
| 2020 | $2,523 | $32,286 | $3,558 | $28,728 |
| 2019 | $2,467 | $31,530 | $3,475 | $28,055 |
| 2018 | $2,326 | $30,352 | $3,434 | $26,918 |
| 2017 | $2,263 | $29,727 | $3,363 | $26,364 |
| 2016 | $2,226 | $29,230 | $3,307 | $25,923 |
| 2015 | $2,168 | $28,629 | $3,239 | $25,390 |
| 2014 | $519 | $29,655 | $3,355 | $26,300 |
| 2013 | $519 | $29,655 | $3,355 | $26,300 |
Source: Public Records
Map
Nearby Homes
- 4828 6th Avenue Dr
- 422 45th St
- 4510 5th Ave
- 250 44th St
- 212 44th St
- 408 43rd St
- 500 54th St Unit A
- 5420 Old River Dr
- 217 40th St
- 411 39th St
- 4202 10th Ave
- 4118 10th Ave
- 906 40th Street Ct
- 5100 11th Avenue C
- 3709 9th Ave
- 2218 3rd St
- 338 23rd Ave
- 3807 10th Avenue Place
- 4216 13th Ave
- 3814 10th Avenue Ct
Your Personal Tour Guide
Ask me questions while you tour the home.