Estimated Value: $406,646 - $440,000
4
Beds
2
Baths
1,702
Sq Ft
$250/Sq Ft
Est. Value
About This Home
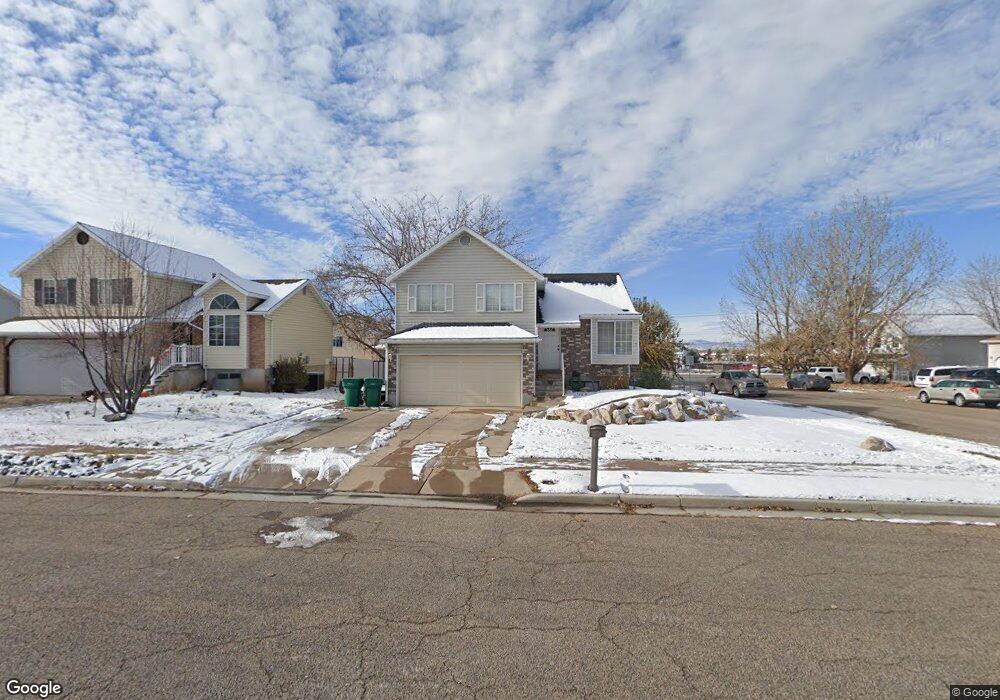
This home is located at 4827 S 3450 W, Roy, UT 84067 and is currently estimated at $425,912, approximately $250 per square foot. 4827 S 3450 W is a home located in Weber County with nearby schools including Midland School, Sand Ridge Junior High School, and Roy High School.
Ownership History
Date
Name
Owned For
Owner Type
Purchase Details
Closed on
Apr 21, 2015
Sold by
Pehrson Matt
Bought by
Laughter Sarah
Current Estimated Value
Home Financials for this Owner
Home Financials are based on the most recent Mortgage that was taken out on this home.
Original Mortgage
$162,011
Outstanding Balance
$123,019
Interest Rate
3.37%
Mortgage Type
FHA
Estimated Equity
$302,893
Purchase Details
Closed on
Apr 8, 2008
Sold by
Miller Justin and Miller Stacy
Bought by
Plankinton James S
Home Financials for this Owner
Home Financials are based on the most recent Mortgage that was taken out on this home.
Original Mortgage
$171,612
Interest Rate
6.22%
Mortgage Type
VA
Purchase Details
Closed on
Nov 21, 1996
Sold by
Keetch Darren Boyd and Keetch Shantel
Bought by
Miller Justin and Miller Stacy
Home Financials for this Owner
Home Financials are based on the most recent Mortgage that was taken out on this home.
Original Mortgage
$95,400
Interest Rate
7.88%
Create a Home Valuation Report for This Property
The Home Valuation Report is an in-depth analysis detailing your home's value as well as a comparison with similar homes in the area
Home Values in the Area
Average Home Value in this Area
Purchase History
| Date | Buyer | Sale Price | Title Company |
|---|---|---|---|
| Laughter Sarah | -- | Mountain View Title Ogden | |
| Plankinton James S | -- | Backman Ntp | |
| Miller Justin | -- | Associated Title |
Source: Public Records
Mortgage History
| Date | Status | Borrower | Loan Amount |
|---|---|---|---|
| Open | Laughter Sarah | $162,011 | |
| Previous Owner | Plankinton James S | $171,612 | |
| Previous Owner | Miller Justin | $95,400 |
Source: Public Records
Tax History Compared to Growth
Tax History
| Year | Tax Paid | Tax Assessment Tax Assessment Total Assessment is a certain percentage of the fair market value that is determined by local assessors to be the total taxable value of land and additions on the property. | Land | Improvement |
|---|---|---|---|---|
| 2025 | $2,519 | $397,594 | $126,792 | $270,802 |
| 2024 | $2,459 | $215,049 | $69,741 | $145,308 |
| 2023 | $2,352 | $205,700 | $63,811 | $141,889 |
| 2022 | $2,550 | $231,551 | $58,493 | $173,058 |
| 2021 | $2,010 | $298,000 | $76,275 | $221,725 |
| 2020 | $1,974 | $270,000 | $76,275 | $193,725 |
| 2019 | $1,911 | $246,000 | $42,082 | $203,918 |
| 2018 | $1,788 | $216,000 | $37,193 | $178,807 |
| 2017 | $1,572 | $176,000 | $37,193 | $138,807 |
| 2016 | $1,598 | $96,803 | $20,830 | $75,973 |
| 2015 | $1,355 | $82,748 | $20,830 | $61,918 |
| 2014 | $1,365 | $78,559 | $20,830 | $57,729 |
Source: Public Records
Map
Nearby Homes
- 3509 W 4835 S Unit 26
- 3524 W 4835 S Unit 22
- 3523 W 4835 S Unit 28
- 4964 S 3375 W
- Poplar Plan at Highgate Cove
- Pando Plan at Highgate Cove
- 3627 W 4650 S
- 3671 W 4700 S
- 3632 W 4650 S
- 3669 W 4625 S
- 3652 W 4625 S
- 3692 W 4625 S
- 3443 W 5200 S Unit 2&3
- 3820 Foxglen Dr
- 3434 W 4525 S
- 4510 Stone Creek Rd Unit F
- 4491 Haven Creek Rd Unit A
- Villages Townhome Plan at Green Farm - Villages
- 3046 W 4850 S
- 4440 Stone Creek Rd Unit 2E