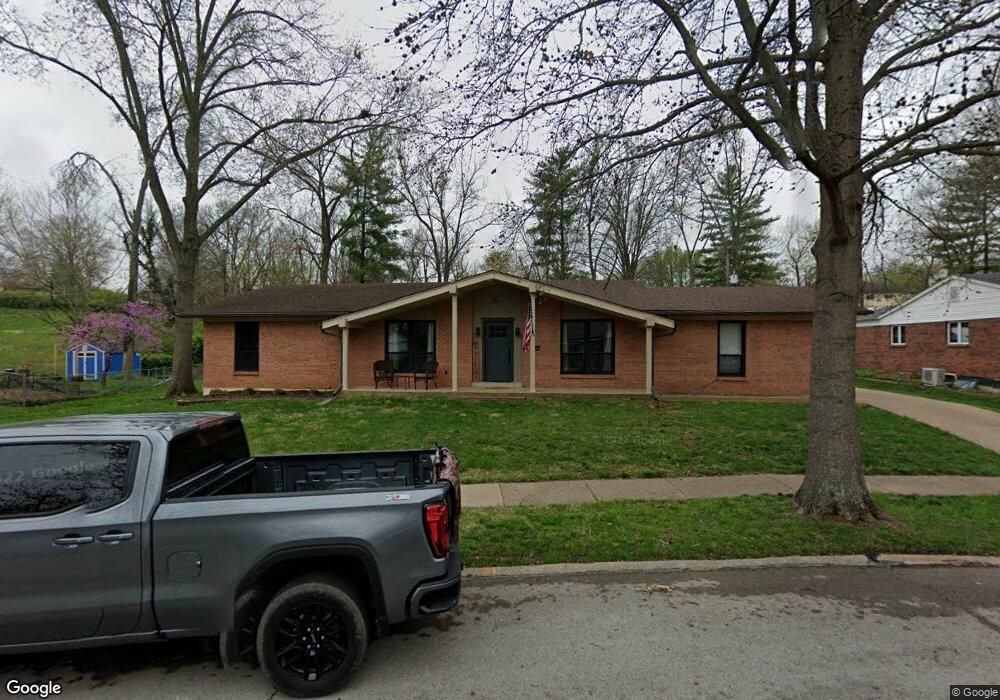
4828 Brunston Dr Saint Louis, MO 63128
Estimated Value: $331,000 - $374,000
4
Beds
3
Baths
1,928
Sq Ft
$184/Sq Ft
Est. Value
About This Home
This home is located at 4828 Brunston Dr, Saint Louis, MO 63128 and is currently estimated at $354,656, approximately $183 per square foot. 4828 Brunston Dr is a home located in St. Louis County with nearby schools including Trautwein Elementary School, Washington Middle School, and Mehlville High School.
Ownership History
Date
Name
Owned For
Owner Type
Purchase Details
Closed on
Sep 4, 2013
Sold by
Caldwell Mary Helen
Bought by
Mccraw Douglas C and Mccraw Michelle C
Current Estimated Value
Home Financials for this Owner
Home Financials are based on the most recent Mortgage that was taken out on this home.
Original Mortgage
$163,400
Outstanding Balance
$121,983
Interest Rate
4.41%
Mortgage Type
Purchase Money Mortgage
Estimated Equity
$232,673
Purchase Details
Closed on
Jan 22, 2009
Sold by
Caldwell Milford and Caldwell Mary Helen
Bought by
Caldwell Mary Helen
Purchase Details
Closed on
May 12, 2000
Sold by
Lucas Larry V and Lucas Faith W
Bought by
Caldwell Milford and Caldwell Mary Helen
Home Financials for this Owner
Home Financials are based on the most recent Mortgage that was taken out on this home.
Original Mortgage
$168,000
Interest Rate
8.14%
Purchase Details
Closed on
Oct 27, 1997
Sold by
Gloss Louis D and Gloss Geraldine D
Bought by
Lucas Larry and Lucas Faith W
Create a Home Valuation Report for This Property
The Home Valuation Report is an in-depth analysis detailing your home's value as well as a comparison with similar homes in the area
Home Values in the Area
Average Home Value in this Area
Purchase History
| Date | Buyer | Sale Price | Title Company |
|---|---|---|---|
| Mccraw Douglas C | $172,000 | Investors Title Co Clayton | |
| Caldwell Mary Helen | -- | None Available | |
| Caldwell Milford | $163,500 | -- | |
| Lucas Larry | -- | Land Title Company |
Source: Public Records
Mortgage History
| Date | Status | Borrower | Loan Amount |
|---|---|---|---|
| Open | Mccraw Douglas C | $163,400 | |
| Previous Owner | Caldwell Milford | $168,000 |
Source: Public Records
Tax History Compared to Growth
Tax History
| Year | Tax Paid | Tax Assessment Tax Assessment Total Assessment is a certain percentage of the fair market value that is determined by local assessors to be the total taxable value of land and additions on the property. | Land | Improvement |
|---|---|---|---|---|
| 2025 | $3,323 | $50,960 | $16,680 | $34,280 |
| 2024 | $3,323 | $49,420 | $12,960 | $36,460 |
| 2023 | $3,281 | $49,420 | $12,960 | $36,460 |
| 2022 | $2,806 | $42,430 | $12,960 | $29,470 |
| 2021 | $2,715 | $42,430 | $12,960 | $29,470 |
| 2020 | $2,635 | $39,160 | $11,120 | $28,040 |
| 2019 | $2,628 | $39,160 | $11,120 | $28,040 |
| 2018 | $2,506 | $33,700 | $9,270 | $24,430 |
| 2017 | $2,502 | $33,700 | $9,270 | $24,430 |
| 2016 | $2,620 | $33,880 | $9,270 | $24,610 |
| 2015 | $2,406 | $33,880 | $9,270 | $24,610 |
| 2014 | $2,950 | $41,210 | $7,220 | $33,990 |
Source: Public Records
Map
Nearby Homes
- 4921 Kerth Rd
- 4508 Frederickton Ct
- 5134 Butler Hill Ct
- 5161 Butler Bend Dr
- 5251 Tuscan Chase Ct
- 4724 Tarlton Dr
- 4833 Hursley Dr
- 4643 Littlebury Dr
- 5057 Peyton Place Ct
- 4839 Hursley Dr
- 4942 Caribee Dr
- 4540 Butler Hill Rd
- 5102 Peyton Place Ct
- 4818 Chapel Hill Dr
- 4525 Eli Dr Unit D
- 4642 Theiss Rd
- 5417 Morningdale Place
- 4829 Vermilion Dr
- 4700 Theiss Rd
- 4501 Eli Dr Unit I
- 4810 Brunston Dr
- 4836 Brunston Dr
- 4738 Brunston Dr
- 4831 Brunston Dr
- 4844 Brunston Dr
- 4809 Brunston Dr
- 4839 Brunston Dr
- 4732 Brunston Dr
- 4565 Towne Centre Dr
- 4735 Brunston Dr
- 4852 Brunston Dr
- 4571 Towne Centre Dr
- 4845 Brunston Dr
- 4577 Towne Centre Dr
- 4837 Sharlane Dr
- 4727 Brunston Dr
- 4547 Towne Centre Dr
- 4858 Brunston Dr
- 4851 Brunston Dr
- 4583 Towne Centre Dr