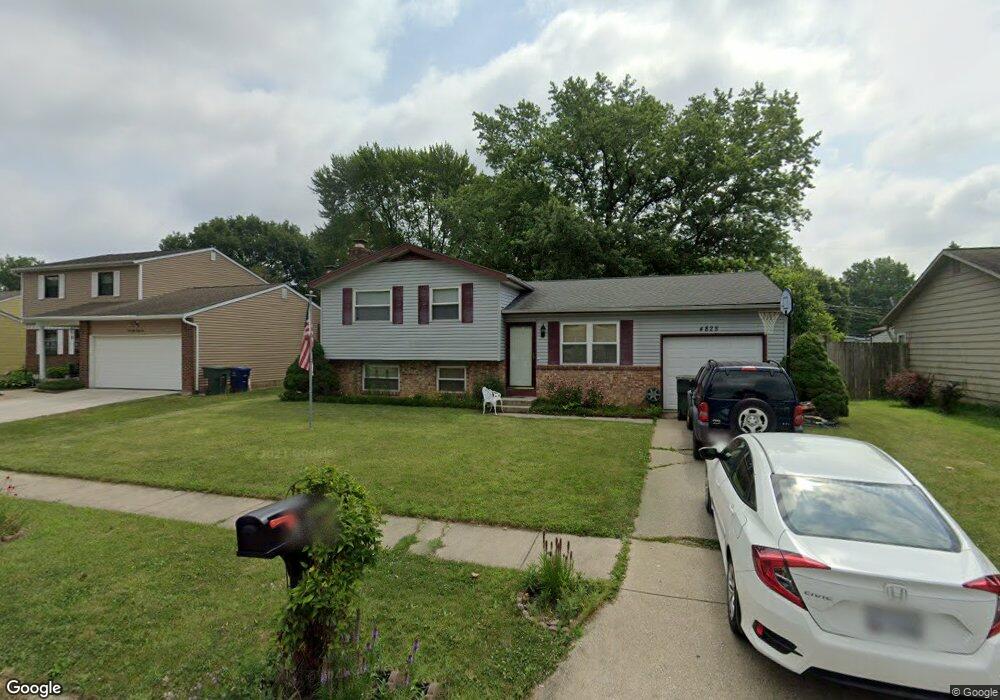
4828 Heaton Rd Columbus, OH 43229
Forest Park East NeighborhoodEstimated Value: $224,912 - $259,000
3
Beds
2
Baths
952
Sq Ft
$252/Sq Ft
Est. Value
About This Home
This home is located at 4828 Heaton Rd, Columbus, OH 43229 and is currently estimated at $240,228, approximately $252 per square foot. 4828 Heaton Rd is a home located in Franklin County with nearby schools including Northtowne Elementary School, Woodward Park Middle School, and Northland High School.
Ownership History
Date
Name
Owned For
Owner Type
Purchase Details
Closed on
Apr 9, 1999
Sold by
Trf Properties Inc
Bought by
Corvi Gary and Corvi Esther
Current Estimated Value
Home Financials for this Owner
Home Financials are based on the most recent Mortgage that was taken out on this home.
Original Mortgage
$82,500
Outstanding Balance
$26,888
Interest Rate
11.75%
Estimated Equity
$213,340
Purchase Details
Closed on
Sep 1, 1997
Sold by
T R F Properties Inc
Bought by
Corvi Gary and Corvi Esther
Home Financials for this Owner
Home Financials are based on the most recent Mortgage that was taken out on this home.
Original Mortgage
$93,000
Interest Rate
6.85%
Mortgage Type
Seller Take Back
Purchase Details
Closed on
Aug 25, 1997
Sold by
Corvi Gary and Corvi Esther
Bought by
Farkas Timothy R
Home Financials for this Owner
Home Financials are based on the most recent Mortgage that was taken out on this home.
Original Mortgage
$93,000
Interest Rate
6.85%
Mortgage Type
Seller Take Back
Purchase Details
Closed on
Dec 17, 1990
Create a Home Valuation Report for This Property
The Home Valuation Report is an in-depth analysis detailing your home's value as well as a comparison with similar homes in the area
Home Values in the Area
Average Home Value in this Area
Purchase History
| Date | Buyer | Sale Price | Title Company |
|---|---|---|---|
| Corvi Gary | $95,000 | Preferred Title Agency Inc | |
| Corvi Gary | $95,000 | -- | |
| Farkas Timothy R | $58,900 | Preferred Title Agency Inc | |
| -- | $68,500 | -- |
Source: Public Records
Mortgage History
| Date | Status | Borrower | Loan Amount |
|---|---|---|---|
| Open | Corvi Gary | $82,500 | |
| Previous Owner | Corvi Gary | $93,000 |
Source: Public Records
Tax History
| Year | Tax Paid | Tax Assessment Tax Assessment Total Assessment is a certain percentage of the fair market value that is determined by local assessors to be the total taxable value of land and additions on the property. | Land | Improvement |
|---|---|---|---|---|
| 2025 | $3,159 | $70,390 | $20,370 | $50,020 |
| 2024 | $3,159 | $70,390 | $20,370 | $50,020 |
| 2023 | $3,119 | $70,385 | $20,370 | $50,015 |
| 2022 | $2,404 | $46,350 | $11,380 | $34,970 |
| 2021 | $2,408 | $46,350 | $11,380 | $34,970 |
| 2020 | $2,411 | $46,350 | $11,380 | $34,970 |
| 2019 | $2,232 | $36,790 | $9,100 | $27,690 |
| 2018 | $2,134 | $36,790 | $9,100 | $27,690 |
| 2017 | $2,240 | $36,790 | $9,100 | $27,690 |
| 2016 | $2,249 | $33,950 | $8,540 | $25,410 |
| 2015 | $2,042 | $33,950 | $8,540 | $25,410 |
| 2014 | $2,047 | $33,950 | $8,540 | $25,410 |
| 2013 | $1,063 | $35,735 | $8,995 | $26,740 |
Source: Public Records
Map
Nearby Homes
- 1905 Denise Dr
- 4979 Lyle Rd
- 4885 Northtowne Blvd
- 4852 Snowbird Cir Unit 13B
- 1685 Norma Rd
- 2177 Margo Rd
- 2251 Tuliptree Ave
- 4923 Karl Rd Unit 4925
- 4909-4911 Karl Rd
- 5004 Julie Place
- 5010 Julie Place
- 1485 Norma Rd
- 4795 Colonel Perry Dr
- 1638 Arrowood Loop N
- 2087 Teakwood Dr
- 5352 Hazelwood Rd
- 1862 Torchwood Dr
- 0 Chester Rd
- 5486 Pine Bluff Rd
- 0 Abington Rd Unit 225045775
- 4820 Heaton Rd
- 4836 Heaton Rd
- 1995 Cannington Ct
- 4844 Heaton Rd
- 4812 Heaton Rd
- 1986 Sharbot Dr
- 4829 Heaton Rd
- 1999 Cannington Ct
- 1994 Sharbot Dr
- 4817 Heaton Rd
- 4852 Heaton Rd
- 1945 Dandridge Dr
- 1952 Dandridge Dr
- 1996 Cannington Ct
- 2002 Sharbot Dr
- 1940 Sharbot Dr Unit 942
- 1975 Sharbot Dr
- 2007 Cannington Ct
- 4860 Heaton Rd
- 1937 Dandridge Dr
Your Personal Tour Guide
Ask me questions while you tour the home.