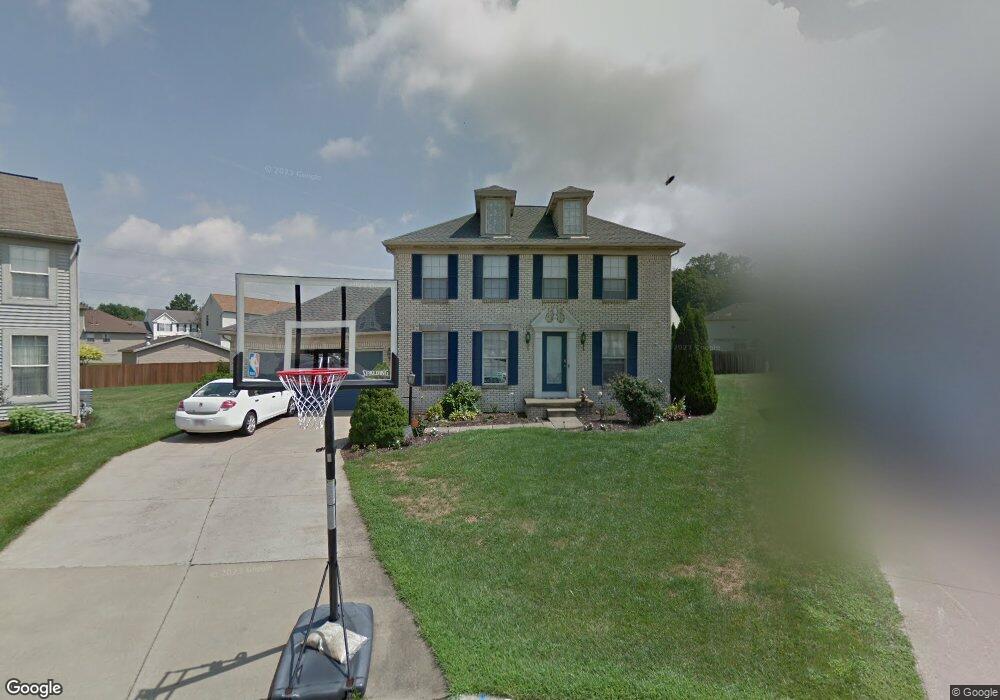
4828 Parwich Cir NE Canton, OH 44705
Martindale Park NeighborhoodEstimated Value: $258,755 - $356,000
3
Beds
3
Baths
1,536
Sq Ft
$198/Sq Ft
Est. Value
About This Home
This home is located at 4828 Parwich Cir NE, Canton, OH 44705 and is currently estimated at $304,189, approximately $198 per square foot. 4828 Parwich Cir NE is a home located in Stark County with nearby schools including Ransom H. Barr Elementary School, Glenwood Intermediate School, and GlenOak High School.
Ownership History
Date
Name
Owned For
Owner Type
Purchase Details
Closed on
Mar 22, 2011
Sold by
Tarle Mark S and Tarle Danielle K
Bought by
Tarle Mark S and Tarle Danielle K
Current Estimated Value
Purchase Details
Closed on
Mar 7, 2003
Sold by
Mullaly Brian P and Mullaly Lisa M
Bought by
Tarle Mark S and Tarle Danielle K
Home Financials for this Owner
Home Financials are based on the most recent Mortgage that was taken out on this home.
Original Mortgage
$120,800
Outstanding Balance
$52,386
Interest Rate
6%
Mortgage Type
Purchase Money Mortgage
Estimated Equity
$251,803
Purchase Details
Closed on
Jun 16, 1999
Sold by
The Drees Company
Bought by
Mullaly Brian P and Mullaly Lisa M
Home Financials for this Owner
Home Financials are based on the most recent Mortgage that was taken out on this home.
Original Mortgage
$121,900
Interest Rate
7.29%
Mortgage Type
Purchase Money Mortgage
Purchase Details
Closed on
Jan 26, 1999
Sold by
Northeast Land Inc
Bought by
The Drees Company
Create a Home Valuation Report for This Property
The Home Valuation Report is an in-depth analysis detailing your home's value as well as a comparison with similar homes in the area
Home Values in the Area
Average Home Value in this Area
Purchase History
| Date | Buyer | Sale Price | Title Company |
|---|---|---|---|
| Tarle Mark S | -- | Attorney | |
| Tarle Mark S | $151,000 | -- | |
| Mullaly Brian P | $143,500 | -- | |
| The Drees Company | $33,000 | -- |
Source: Public Records
Mortgage History
| Date | Status | Borrower | Loan Amount |
|---|---|---|---|
| Open | Tarle Mark S | $120,800 | |
| Previous Owner | Mullaly Brian P | $121,900 |
Source: Public Records
Tax History Compared to Growth
Tax History
| Year | Tax Paid | Tax Assessment Tax Assessment Total Assessment is a certain percentage of the fair market value that is determined by local assessors to be the total taxable value of land and additions on the property. | Land | Improvement |
|---|---|---|---|---|
| 2025 | -- | $79,140 | $21,180 | $57,960 |
| 2024 | -- | $79,140 | $21,180 | $57,960 |
| 2023 | $2,628 | $68,150 | $20,790 | $47,360 |
| 2022 | $2,639 | $68,150 | $20,790 | $47,360 |
| 2021 | $2,649 | $68,150 | $20,790 | $47,360 |
| 2020 | $2,564 | $58,210 | $17,920 | $40,290 |
| 2019 | $2,536 | $58,210 | $17,920 | $40,290 |
| 2018 | $2,497 | $58,210 | $17,920 | $40,290 |
| 2017 | $2,516 | $54,090 | $18,070 | $36,020 |
| 2016 | $2,519 | $54,090 | $18,070 | $36,020 |
| 2015 | $2,519 | $54,090 | $18,070 | $36,020 |
| 2014 | $630 | $53,880 | $18,000 | $35,880 |
| 2013 | $1,319 | $53,880 | $18,000 | $35,880 |
Source: Public Records
Map
Nearby Homes
- 2211 48th St NE
- 2216 49th St NE
- 4613 Magnolia Rd NE
- 4662 Helmsworth Dr NE
- 4701 Roosevelt Ave NE
- 1920 Birk Cir NE
- 2317 Raintree St NE
- 1852 Southpointe Cir NE Unit 39W
- 1709 Southpointe Cir NE Unit 25W
- 2419 Bur Oak St NE
- 2040 55th St NE
- 5409 Glenhill Ave NE
- 1327 44th St NE
- 1912 40th St NE
- 5225 Loma Linda Ln NE
- 2426 40th St NE
- 1902 39th St NE
- 4654 Beverly Ave NE
- 5242 Aster Ave NE
- 815 44th St NE
- 4824 Parwich Cir NE
- 4832 Parwich Cir NE
- 4831 Laverton Ave NE
- 4839 Laverton Ave NE
- 1928 49th St NE
- 1920 49th St NE
- 4825 Laverton Ave NE
- 4845 Laverton Ave NE
- 4816 Parwich Cir NE
- 4831 Parwich Cir NE
- 1914 49th St NE
- 4817 Laverton Ave NE
- 4853 Laverton Ave NE
- 4825 Parwich Cir NE
- 4810 Parwich Cir NE
- 4817 Parwich Cir NE
- 1906 49th St NE
- 4811 Laverton Ave NE
- 4838 Laverton Ave NE
- 4811 Parwich Cir NE