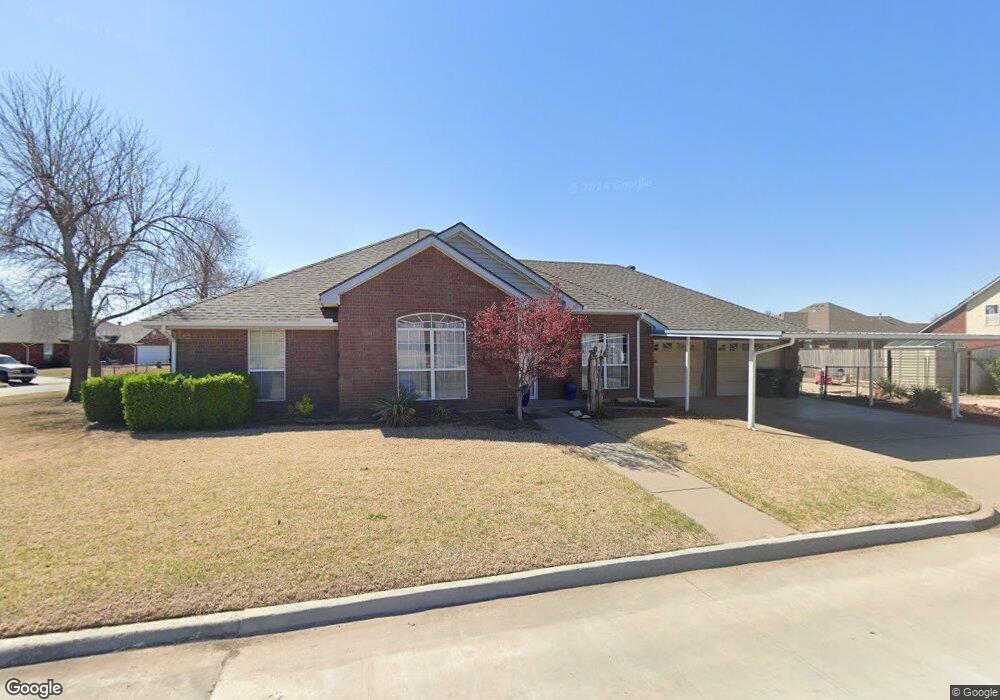
4828 SE 41st St Oklahoma City, OK 73115
Estimated Value: $247,000 - $271,000
3
Beds
2
Baths
2,042
Sq Ft
$128/Sq Ft
Est. Value
About This Home
This home is located at 4828 SE 41st St, Oklahoma City, OK 73115 and is currently estimated at $262,291, approximately $128 per square foot. 4828 SE 41st St is a home located in Oklahoma County with nearby schools including Townsend Elementary School, Kerr Middle School, and Del City High School.
Ownership History
Date
Name
Owned For
Owner Type
Purchase Details
Closed on
Jul 28, 2023
Sold by
Gately Raymond H
Bought by
Rodriguez Guadalupe and Rodriguez Niki
Current Estimated Value
Home Financials for this Owner
Home Financials are based on the most recent Mortgage that was taken out on this home.
Original Mortgage
$242,580
Outstanding Balance
$236,928
Interest Rate
6.69%
Mortgage Type
Construction
Estimated Equity
$25,363
Purchase Details
Closed on
Apr 27, 2000
Sold by
Isaacs Cato Angela and Cato Bennie Earl
Bought by
Gately Raymond H and Gately Marcella F
Create a Home Valuation Report for This Property
The Home Valuation Report is an in-depth analysis detailing your home's value as well as a comparison with similar homes in the area
Home Values in the Area
Average Home Value in this Area
Purchase History
| Date | Buyer | Sale Price | Title Company |
|---|---|---|---|
| Rodriguez Guadalupe | $240,000 | Chicago Title | |
| Gately Raymond H | $12,000 | Stewart Escrow & Title |
Source: Public Records
Mortgage History
| Date | Status | Borrower | Loan Amount |
|---|---|---|---|
| Open | Rodriguez Guadalupe | $242,580 |
Source: Public Records
Tax History Compared to Growth
Tax History
| Year | Tax Paid | Tax Assessment Tax Assessment Total Assessment is a certain percentage of the fair market value that is determined by local assessors to be the total taxable value of land and additions on the property. | Land | Improvement |
|---|---|---|---|---|
| 2024 | $1,810 | $31,625 | $2,684 | $28,941 |
| 2023 | $1,810 | $16,093 | $1,517 | $14,576 |
| 2022 | $1,587 | $15,327 | $1,662 | $13,665 |
| 2021 | $1,643 | $15,327 | $1,842 | $13,485 |
| 2020 | $1,687 | $15,327 | $1,757 | $13,570 |
| 2019 | $1,636 | $15,327 | $1,743 | $13,584 |
| 2018 | $1,659 | $15,327 | $0 | $0 |
| 2017 | $1,671 | $15,326 | $1,838 | $13,488 |
| 2016 | $1,717 | $15,327 | $1,850 | $13,477 |
| 2015 | $1,727 | $15,326 | $1,920 | $13,406 |
| 2014 | $1,723 | $15,326 | $1,921 | $13,405 |
Source: Public Records
Map
Nearby Homes
- 4732 Princess Ln
- 4729 SE 43rd St
- 4853 Montclair Dr
- 5225 SE 45th Terrace
- 4113 Vickie Dr
- 4625 SE 42nd St
- 3500 Del View Dr
- 4613 SE 41st St
- 3413 Del View Dr
- 4704 Tempo Dr
- 4728 SE 45th St
- 3128 Del View Dr
- 4205 Epperly Dr
- 4540 SE 35th St
- 4809 Elmview Dr
- 4813 Elmview Dr
- 4428 SE 39th St
- 4428 SE 38th St
- 4709 SE 47th St
- 5024 Cinder Dr
- 4205 Lamar Dr
- 4209 Lamar Dr
- 4829 SE 41st St
- 4833 SE 41st St
- 4820 SE 41st St
- 4836 SE 41st St
- 4204 Lamar Dr
- 4837 SE 41st St
- 4821 SE 41st St
- 4213 Lamar Dr
- 4816 SE 41st St
- 4204 Oakbrook Dr
- 4212 Lamar Dr
- 4841 SE 41st St
- 4817 SE 41st St
- 4828 Montrose Dr
- 4844 SE 41st St
- 4824 Montrose Dr
- 4832 Montrose Dr
- 4820 Montrose Dr