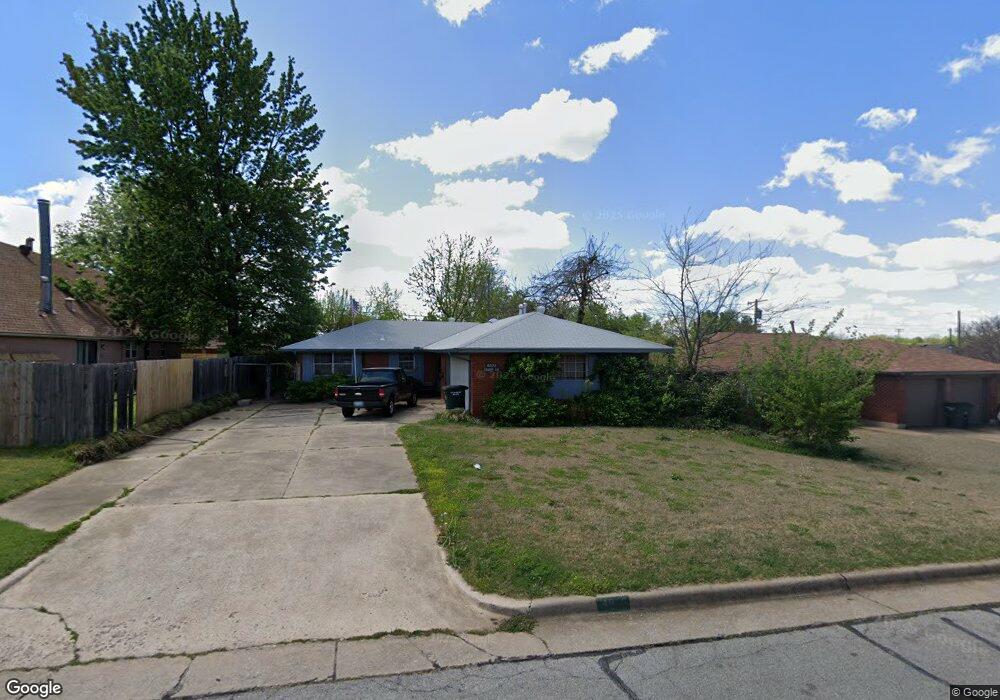
4828 Trapp Dr Oklahoma City, OK 73115
Estimated Value: $142,556 - $165,000
2
Beds
2
Baths
1,107
Sq Ft
$137/Sq Ft
Est. Value
About This Home
This home is located at 4828 Trapp Dr, Oklahoma City, OK 73115 and is currently estimated at $152,139, approximately $137 per square foot. 4828 Trapp Dr is a home located in Oklahoma County with nearby schools including Bonham Elementary School, Midwest City Elementary School, and Rice Challenge Academy.
Ownership History
Date
Name
Owned For
Owner Type
Purchase Details
Closed on
Mar 28, 2022
Sold by
Leo Mcglasson Living Trust
Bought by
Mcglasson Kevin Alan
Current Estimated Value
Purchase Details
Closed on
May 30, 2008
Sold by
Mcglasson Kevin Alan
Bought by
Mcglasson Leo C
Purchase Details
Closed on
Jun 19, 1997
Sold by
Barmark L L C
Bought by
Mcglasson Kevin Alan
Home Financials for this Owner
Home Financials are based on the most recent Mortgage that was taken out on this home.
Original Mortgage
$50,800
Interest Rate
7.93%
Mortgage Type
Purchase Money Mortgage
Create a Home Valuation Report for This Property
The Home Valuation Report is an in-depth analysis detailing your home's value as well as a comparison with similar homes in the area
Home Values in the Area
Average Home Value in this Area
Purchase History
| Date | Buyer | Sale Price | Title Company |
|---|---|---|---|
| Mcglasson Kevin Alan | -- | Coleman Law Office | |
| Mcglasson Leo C | -- | None Available | |
| Mcglasson Kevin Alan | $53,500 | -- |
Source: Public Records
Mortgage History
| Date | Status | Borrower | Loan Amount |
|---|---|---|---|
| Previous Owner | Mcglasson Kevin Alan | $50,800 |
Source: Public Records
Tax History Compared to Growth
Tax History
| Year | Tax Paid | Tax Assessment Tax Assessment Total Assessment is a certain percentage of the fair market value that is determined by local assessors to be the total taxable value of land and additions on the property. | Land | Improvement |
|---|---|---|---|---|
| 2024 | $1,124 | $10,935 | $2,120 | $8,815 |
| 2023 | $1,124 | $9,996 | $1,478 | $8,518 |
| 2022 | $1,054 | $9,519 | $1,558 | $7,961 |
| 2021 | $1,040 | $9,066 | $1,728 | $7,338 |
| 2020 | $1,017 | $8,635 | $1,845 | $6,790 |
| 2019 | $1,029 | $9,009 | $1,692 | $7,317 |
| 2018 | $993 | $8,580 | $0 | $0 |
| 2017 | $994 | $8,524 | $1,694 | $6,830 |
| 2016 | $1,009 | $8,414 | $1,694 | $6,720 |
| 2015 | $985 | $8,169 | $1,749 | $6,420 |
| 2014 | $937 | $7,788 | $1,749 | $6,039 |
Source: Public Records
Map
Nearby Homes
- 4720 Trapp Dr
- 410 Vickie Dr
- 4916 Jeffery Dr
- 605 S Sooner Rd
- 4937 Jeffery Dr
- 4800 Gina Place
- 310 S Sooner Rd
- 1017 Howard Dr
- 4812 Del Crest Dr
- 816 S Sooner Rd
- 4761 Koelsch Dr
- 5804 SE 7th St
- 4412 E Reno St
- 720 Del Haven Dr
- 4408 E Reno Ave
- 1311 Sean Ct
- 1306 Sean Ct
- 613 Mark Dr
- 1318 Alviola Ave
- 1321 Alviola Ave