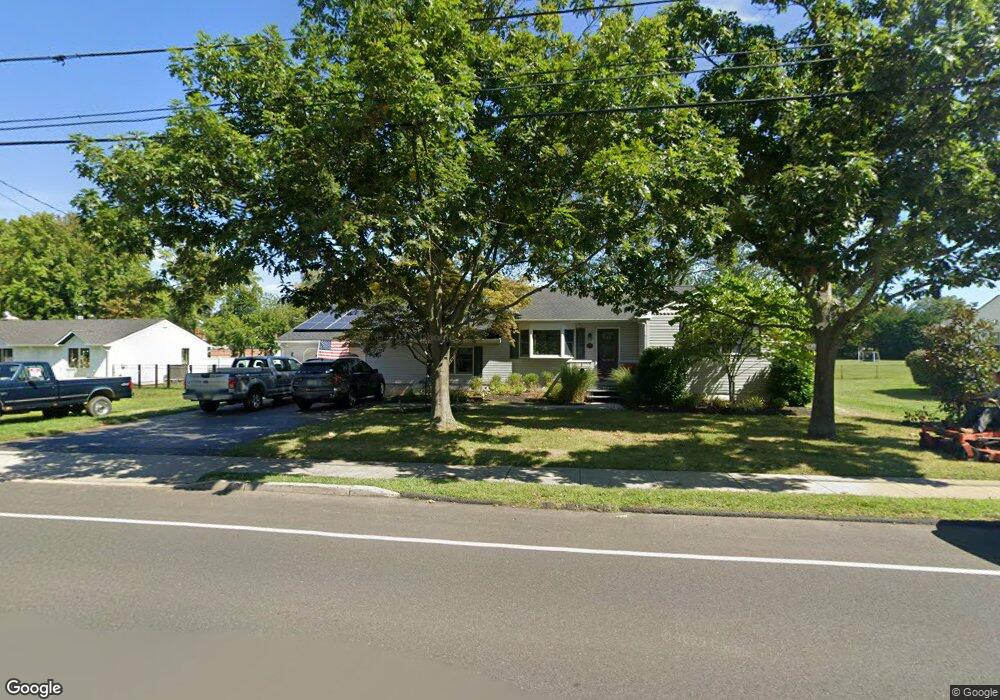
483 Branchport Ave Oceanport, NJ 07757
Estimated Value: $717,000 - $831,000
3
Beds
1
Bath
1,600
Sq Ft
$475/Sq Ft
Est. Value
About This Home
This home is located at 483 Branchport Ave, Oceanport, NJ 07757 and is currently estimated at $760,317, approximately $475 per square foot. 483 Branchport Ave is a home located in Monmouth County with nearby schools including Wolf Hill Elementary School, Maple Place Elementary and Middle School, and Shore Regional High School.
Ownership History
Date
Name
Owned For
Owner Type
Purchase Details
Closed on
May 13, 2018
Sold by
Bennett Linda W
Bought by
Bennett Linda W and Bennett Lori
Current Estimated Value
Purchase Details
Closed on
Nov 16, 1992
Bought by
Carroll John R and Carroll Francene R
Create a Home Valuation Report for This Property
The Home Valuation Report is an in-depth analysis detailing your home's value as well as a comparison with similar homes in the area
Home Values in the Area
Average Home Value in this Area
Purchase History
| Date | Buyer | Sale Price | Title Company |
|---|---|---|---|
| Bennett Linda W | -- | None Available | |
| Carroll John R | $118,000 | -- |
Source: Public Records
Tax History Compared to Growth
Tax History
| Year | Tax Paid | Tax Assessment Tax Assessment Total Assessment is a certain percentage of the fair market value that is determined by local assessors to be the total taxable value of land and additions on the property. | Land | Improvement |
|---|---|---|---|---|
| 2025 | $8,449 | $577,000 | $401,000 | $176,000 |
| 2024 | $8,689 | $535,100 | $366,800 | $168,300 |
| 2023 | $8,689 | $522,200 | $362,300 | $159,900 |
| 2022 | $8,081 | $458,100 | $317,300 | $140,800 |
| 2021 | $8,081 | $424,200 | $290,300 | $133,900 |
| 2020 | $7,398 | $404,700 | $275,000 | $129,700 |
| 2019 | $7,046 | $391,200 | $266,000 | $125,200 |
| 2018 | $6,972 | $389,700 | $266,000 | $123,700 |
| 2017 | $6,057 | $280,800 | $159,300 | $121,500 |
| 2016 | $6,103 | $284,800 | $165,600 | $119,200 |
| 2015 | $5,842 | $281,700 | $165,600 | $116,100 |
| 2014 | $5,886 | $287,800 | $174,600 | $113,200 |
Source: Public Records
Map
Nearby Homes
- 66 Shrewsbury Ave
- 13 Morris Place
- 15 Signal Ave
- 3 Foggia Way
- 10 Asbury Ave
- 265 Port Au Peck Ave
- 222 Coleman Ave
- 8 Pocahontas Ave
- 238 Branchport Ave
- 572 Jay St
- 565 Joline Ave
- 190 Spruce St Unit 4
- 401 Joline Ave
- 28 Patten Ln
- 631 Irving Place
- 580 Patten Ave Unit 48
- 580 Patten Ave Unit 62
- 580 Patten Ave Unit 86
- 580 Patten Ave Unit 31
- 392 Florence Ave
- 475 Branchport Ave
- 489 Branchport Ave
- 480 Branchport Ave
- 471 Branchport Ave
- 484 Branchport Ave
- 26 Colonial Dr
- 476 Branchport Ave
- 488 Branchport Ave
- 491 Branchport Ave
- 469 Branchport Ave
- 474 Branchport Ave
- 492 Branchport Ave
- 28 Revere Dr
- 24 Colonial Dr
- 495 Branchport Ave
- 30 Revere Dr
- 494 Branchport Ave
- 305 Port Au Peck Ave
- 299 Port Au Peck Ave
- 311 Port Au Peck Ave