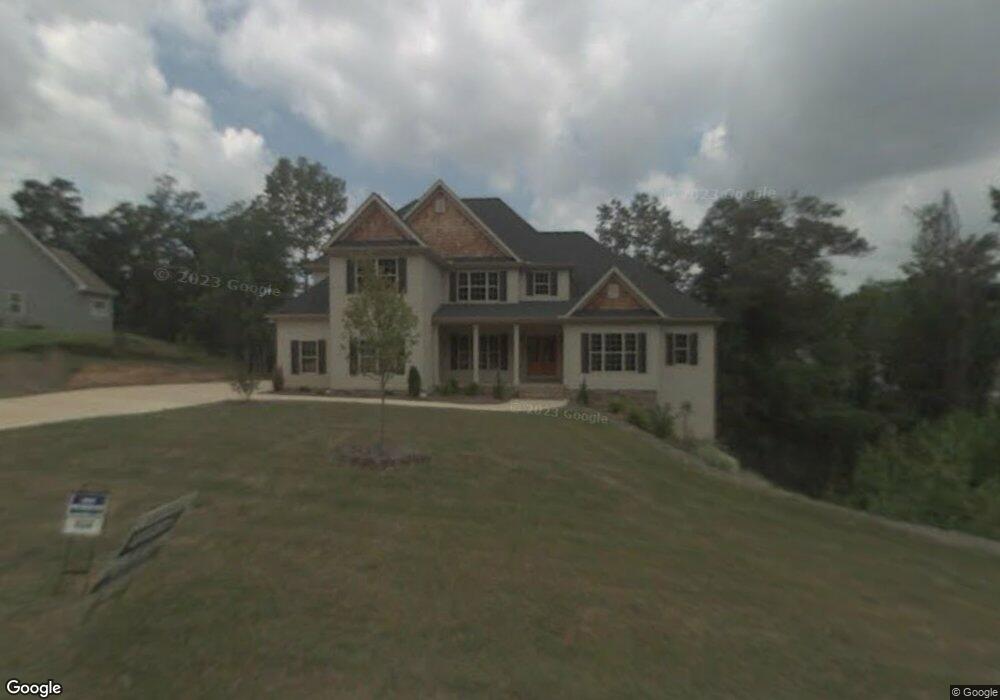
483 Clover Mill Dr Jefferson, GA 30549
Estimated Value: $601,261 - $724,000
--
Bed
5
Baths
3,697
Sq Ft
$181/Sq Ft
Est. Value
About This Home
This home is located at 483 Clover Mill Dr, Jefferson, GA 30549 and is currently estimated at $668,315, approximately $180 per square foot. 483 Clover Mill Dr is a home located in Jackson County with nearby schools including Gum Springs Elementary School, West Jackson Middle School, and Jackson County High School.
Ownership History
Date
Name
Owned For
Owner Type
Purchase Details
Closed on
Dec 15, 2010
Sold by
Conner Robert Jason
Bought by
Conner Robert Jason
Current Estimated Value
Home Financials for this Owner
Home Financials are based on the most recent Mortgage that was taken out on this home.
Original Mortgage
$262,044
Outstanding Balance
$168,940
Interest Rate
3.75%
Mortgage Type
FHA
Estimated Equity
$499,375
Purchase Details
Closed on
Nov 20, 2008
Sold by
Branch Banking Co
Bought by
Conner Robert Jason and Beck Amy Christine
Home Financials for this Owner
Home Financials are based on the most recent Mortgage that was taken out on this home.
Original Mortgage
$267,470
Interest Rate
6.01%
Mortgage Type
FHA
Purchase Details
Closed on
Nov 6, 2007
Sold by
Not Provided
Bought by
Beck Conner Robert Jason and Beck Conner Amy
Purchase Details
Closed on
Nov 10, 2004
Sold by
Barnett Wilma
Bought by
Buckeye Land and Buckeye Timber
Create a Home Valuation Report for This Property
The Home Valuation Report is an in-depth analysis detailing your home's value as well as a comparison with similar homes in the area
Home Values in the Area
Average Home Value in this Area
Purchase History
| Date | Buyer | Sale Price | Title Company |
|---|---|---|---|
| Conner Robert Jason | -- | -- | |
| Conner Robert Jason | $271,000 | -- | |
| Beck Conner Robert Jason | -- | -- | |
| Buckeye Land | -- | -- | |
| Sue Campbell Properties Inc | $100,000 | -- | |
| Sue Campbell Properties Inc | -- | -- | |
| Sue Campbell Properties Inc | $100,000 | -- |
Source: Public Records
Mortgage History
| Date | Status | Borrower | Loan Amount |
|---|---|---|---|
| Open | Conner Robert Jason | $262,044 | |
| Previous Owner | Conner Robert Jason | $267,470 |
Source: Public Records
Tax History Compared to Growth
Tax History
| Year | Tax Paid | Tax Assessment Tax Assessment Total Assessment is a certain percentage of the fair market value that is determined by local assessors to be the total taxable value of land and additions on the property. | Land | Improvement |
|---|---|---|---|---|
| 2024 | $5,986 | $232,760 | $17,680 | $215,080 |
| 2023 | $5,986 | $209,520 | $17,680 | $191,840 |
| 2022 | $4,967 | $172,640 | $17,680 | $154,960 |
| 2021 | $5,001 | $172,640 | $17,680 | $154,960 |
| 2020 | $4,497 | $142,200 | $17,680 | $124,520 |
| 2019 | $4,565 | $142,200 | $17,680 | $124,520 |
| 2018 | $4,422 | $136,160 | $17,680 | $118,480 |
| 2017 | $4,179 | $127,718 | $17,680 | $110,038 |
| 2016 | $4,202 | $127,718 | $17,680 | $110,038 |
| 2015 | $3,890 | $118,538 | $8,500 | $110,038 |
| 2014 | $3,250 | $99,191 | $10,000 | $89,191 |
| 2013 | -- | $74,000 | $10,000 | $64,000 |
Source: Public Records
Map
Nearby Homes
- 41 Doster Crest Rd
- 847 Wellford Ave
- 565 Skelton Rd
- 3834 Highway 124 W
- 265 Laurel Cove Dr
- 1084 Skelton Rd
- 86 Cottonwood Rd
- 113 Skelton Rd
- 79 White Plains Church Rd
- 144 Braselton Farms Dr
- 335 Jones Rd
- 241 Jones Rd
- 77 Wildcherry Ct
- 2932 Highway 124 W
- 463 Delaperriere Loop
- 485 Delaperriere Lot 44 D Loop
- 485 Delaperriere D Loop Unit LOT 44
- 387 Fern Ct
- 257 Winding Ridge Trail
- 257 Winding Ridge Trail Unit LOT 14
- 451 Clover Mill Dr
- 21 Doster Cove Rd
- 39 Doster Cove Rd
- 429 Clover Mill Dr
- 20 Doster Crest Rd
- 27 Honey Tree Rd
- 16 Honey Tree Rd
- 407 Clover Mill Dr
- 36 Doster Cove Rd
- 561 Clover Mill Dr
- 67 Honey Tree Rd
- 40 Doster Crest Rd
- 48 Honey Tree Rd
- 29 Doster Crest Rd
- 377 Clover Mill Dr
- 42 Doster Crest Rd
- 585 Clover Mill Dr
- 42 Doster Creek Rd
- 0 Doster Crest Rd
- 25 Clover Ridge Rd