483 E 6th St Gilroy, CA 95020
Estimated Value: $553,283 - $835,000
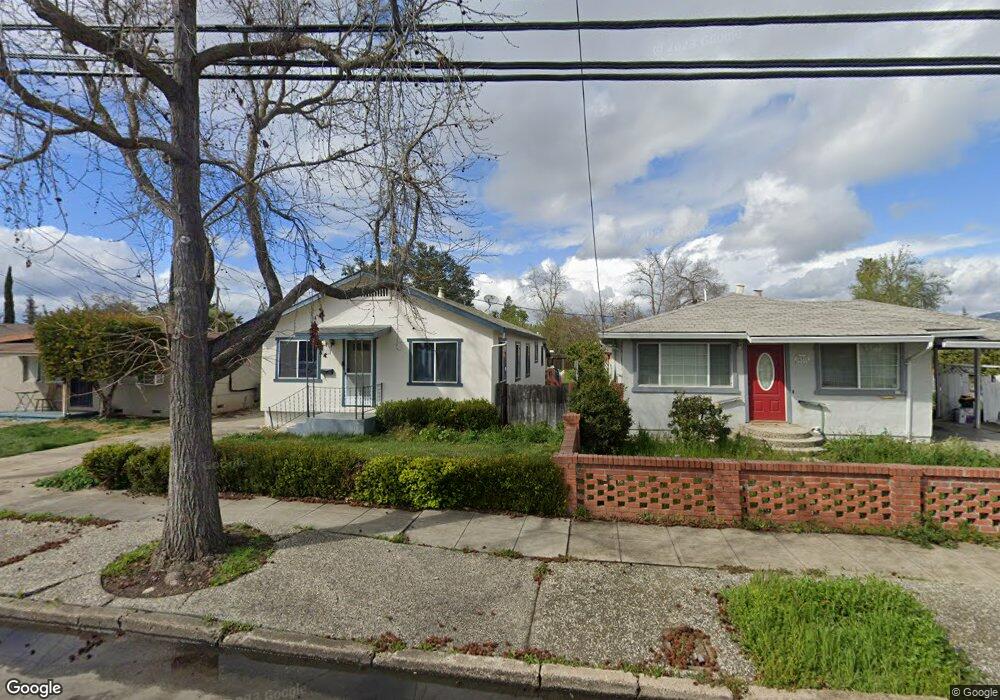
About This Home
This home is located at 483 E 6th St, Gilroy, CA 95020 and is currently estimated at $665,571, approximately $967 per square foot. 483 E 6th St is a home located in Santa Clara County with nearby schools including Eliot Elementary School, Brownell Middle School, and Solorsano Middle School.
Ownership History
We collect this data history from publicly available records. To have your information removed, we recommend requesting removal directly through your county’s website.
Purchase Details
Home Financials for this Owner
Home Financials are based on the most recent Mortgage that was taken out on this home.Home Values in the Area
Average Home Value in this Area
Purchase History
We collect this data history from publicly available records. To have your information removed, we recommend requesting removal directly through your county’s website.
| Date | Buyer | Sale Price | Title Company |
|---|---|---|---|
| $94,000 | Commonwealth Land Title Co |
Mortgage History
We collect this data history from publicly available records. To have your information removed, we recommend requesting removal directly through your county’s website.
| Date | Status | Borrower | Loan Amount |
|---|---|---|---|
| Open | $95,880 |
Tax History
We collect this data history from publicly available records. To have your information removed, we recommend requesting removal directly through your county’s website.
| Year | Tax Paid | Tax Assessment Tax Assessment Total Assessment is a certain percentage of the fair market value that is determined by local assessors to be the total taxable value of land and additions on the property. | Land | Improvement |
|---|---|---|---|---|
| 2025 | $1,889 | $153,066 | $55,360 | $97,706 |
| 2024 | $1,889 | $150,066 | $54,275 | $95,791 |
| 2023 | $1,875 | $147,124 | $53,211 | $93,913 |
| 2022 | $1,842 | $144,240 | $52,168 | $92,072 |
| 2021 | $1,829 | $141,413 | $51,146 | $90,267 |
| 2020 | $1,808 | $139,964 | $50,622 | $89,342 |
| 2019 | $1,791 | $137,221 | $49,630 | $87,591 |
| 2018 | $1,675 | $134,531 | $48,657 | $85,874 |
| 2017 | $1,705 | $131,894 | $47,703 | $84,191 |
| 2016 | $1,660 | $129,309 | $46,768 | $82,541 |
| 2015 | $1,568 | $127,368 | $46,066 | $81,302 |
| 2014 | $1,556 | $124,874 | $45,164 | $79,710 |
Map
- 7515 Chestnut St
- 332 Lewis St
- 7429 Alexander St
- 7759 Murray Ave
- 0 Monterey Rd
- 111 5th St
- 7711 Monterey St
- 0 Pacheco Pass Hwy
- 301 W 6th St
- 140 2nd St
- 7601 Rosanna St
- 8282 Murray Ave Unit 99
- 8282 Murray Ave Unit 5
- 7621 Hanna St
- 8240 Springdale Ct
- 7841 Rosanna St
- 700 Eschenburg Dr
- 500 W 10th St Unit 119
- 500 W 10th St Unit 29
- 500 W 10th St Unit 140
Ask me questions while you tour the home.