

483 E 7th St Unit 2 Boston, MA 02127
South Boston Neighborhood
1
Bed
1
Bath
460
Sq Ft
436
Sq Ft Lot
About This Home
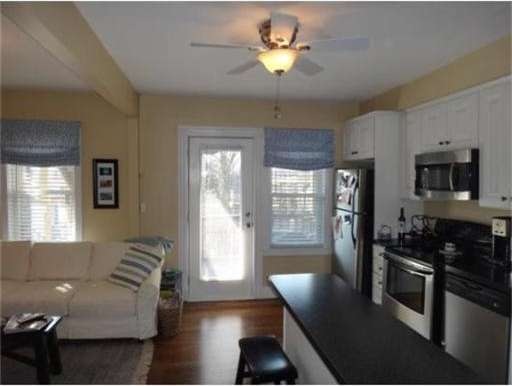
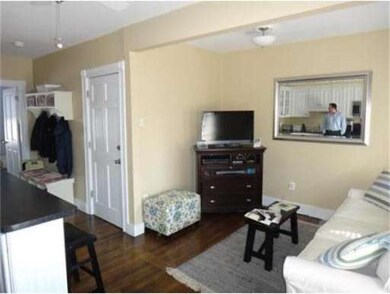
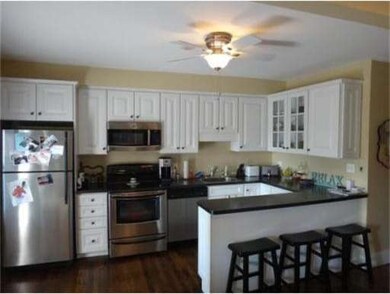
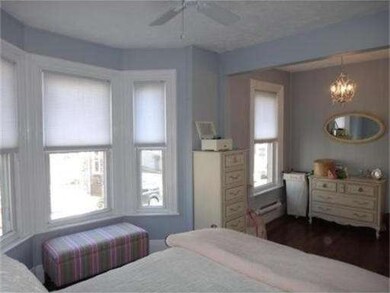
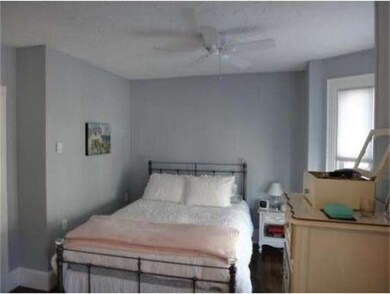
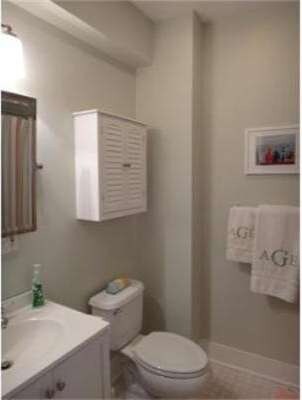
As of May 2025PREMIER EAST SIDE LOCATION! OPEN LIVING FLOOR PLAN WITH FULLY APPLIANCED STAINLESS STEEL KITCHEN WITH BREAKFAST BAR, KING SIZE BEDROOM, HARDWOOD FLOORS, LAUNDRY AND STONE BATH. PET FRIENDLY, LOW CONDO FEE AND EXCLUSIVE DECK ADD TO THIS HOMES APPEAL. FIRST SHOWING SUNDAY 12-2
Last Agent to Sell the Property
Joyce Lebedew
Joyce Lebedew Real Estate Listed on: 05/02/2014
Property Details
Home Type
Condominium
Est. Annual Taxes
$4,966
Year Built
1890
Lot Details
0
Listing Details
- Unit Level: 2
- Special Features: None
- Property Sub Type: Condos
- Year Built: 1890
Interior Features
- Has Basement: Yes
- Number of Rooms: 3
Garage/Parking
- Parking Spaces: 0
Condo/Co-op/Association
- Association Fee Includes: Water, Sewer, Master Insurance
- No Units: 3
- Unit Building: 2
Ownership History
Date
Name
Owned For
Owner Type
Purchase Details
Listed on
Mar 18, 2025
Closed on
May 20, 2025
Sold by
Kelly Daniel D and Kelly Jillian
Bought by
Bulens Brittany
Seller's Agent
Anthony Coppola
Coldwell Banker Realty - Waltham
Buyer's Agent
Sandra McCarron
Capital Residential Group, LLC
List Price
$529,000
Sold Price
$529,000
Views
17
Home Financials for this Owner
Home Financials are based on the most recent Mortgage that was taken out on this home.
Avg. Annual Appreciation
-10.99%
Original Mortgage
$386,000
Outstanding Balance
$385,319
Interest Rate
6.64%
Mortgage Type
Purchase Money Mortgage
Estimated Equity
$132,113
Purchase Details
Listed on
Mar 3, 2022
Closed on
Feb 25, 2022
Sold by
Lehman Kathryn
Bought by
Kelly Daniel D and English Jillian L
Seller's Agent
Dante Bruzzese
Compass
Buyer's Agent
Jackie Rooney
Rooney Real Estate, LLC
Sold Price
$2,400
Home Financials for this Owner
Home Financials are based on the most recent Mortgage that was taken out on this home.
Avg. Annual Appreciation
3.06%
Original Mortgage
$363,750
Interest Rate
3.55%
Mortgage Type
Purchase Money Mortgage
Purchase Details
Listed on
May 30, 2018
Closed on
Jul 13, 2018
Sold by
Readyhough Allison A
Bought by
Lehman Kathryn
Seller's Agent
Sarah Herbert
Charlesgate Realty Group, llc
Buyer's Agent
Chris Tuite
Compass
List Price
$399,000
Sold Price
$427,000
Premium/Discount to List
$28,000
7.02%
Home Financials for this Owner
Home Financials are based on the most recent Mortgage that was taken out on this home.
Avg. Annual Appreciation
3.28%
Original Mortgage
$341,600
Interest Rate
3.75%
Mortgage Type
New Conventional
Purchase Details
Listed on
May 2, 2014
Closed on
Aug 1, 2014
Sold by
Lavoie Amy E
Bought by
Readhough Allison A
Seller's Agent
Joyce Lebedew
Joyce Lebedew Real Estate
Buyer's Agent
Amy Fairchild
Gibson Sotheby's International Realty
List Price
$329,000
Sold Price
$315,000
Premium/Discount to List
-$14,000
-4.26%
Home Financials for this Owner
Home Financials are based on the most recent Mortgage that was taken out on this home.
Avg. Annual Appreciation
8.01%
Original Mortgage
$252,000
Interest Rate
4.18%
Mortgage Type
New Conventional
Purchase Details
Closed on
May 4, 2010
Sold by
Sunday Kelly and Yarborough Kelly
Bought by
Groccia Amy E
Purchase Details
Closed on
Jun 16, 2005
Sold by
Acton Ann E
Bought by
Yarborough Kelly
Similar Homes in the area
Create a Home Valuation Report for This Property
The Home Valuation Report is an in-depth analysis detailing your home's value as well as a comparison with similar homes in the area
Home Values in the Area
Average Home Value in this Area
Purchase History
| Date | Type | Sale Price | Title Company |
|---|---|---|---|
| Deed | $529,000 | None Available | |
| Deed | $529,000 | None Available | |
| Condominium Deed | $485,000 | None Available | |
| Condominium Deed | $485,000 | None Available | |
| Deed | $427,000 | -- | |
| Deed | $427,000 | -- | |
| Not Resolvable | $315,000 | -- | |
| Deed | $241,500 | -- | |
| Deed | $241,500 | -- | |
| Deed | $250,000 | -- | |
| Deed | $250,000 | -- |
Source: Public Records
Mortgage History
| Date | Status | Loan Amount | Loan Type |
|---|---|---|---|
| Open | $386,000 | Purchase Money Mortgage | |
| Closed | $386,000 | Purchase Money Mortgage | |
| Closed | $25,000 | Second Mortgage Made To Cover Down Payment | |
| Previous Owner | $363,750 | Purchase Money Mortgage | |
| Previous Owner | $330,000 | Stand Alone Refi Refinance Of Original Loan | |
| Previous Owner | $341,600 | New Conventional | |
| Previous Owner | $250,500 | Stand Alone Refi Refinance Of Original Loan | |
| Previous Owner | $31,500 | Credit Line Revolving | |
| Previous Owner | $252,000 | New Conventional | |
| Previous Owner | $31,500 | Credit Line Revolving |
Source: Public Records
Property History
| Date | Event | Price | Change | Sq Ft Price |
|---|---|---|---|---|
| 05/20/2025 05/20/25 | Sold | $529,000 | 0.0% | $1,150 / Sq Ft |
| 04/01/2025 04/01/25 | Pending | -- | -- | -- |
| 03/18/2025 03/18/25 | For Sale | $529,000 | 0.0% | $1,150 / Sq Ft |
| 03/09/2023 03/09/23 | Rented | $2,450 | 0.0% | -- |
| 03/04/2023 03/04/23 | Under Contract | -- | -- | -- |
| 02/27/2023 02/27/23 | For Rent | $2,450 | +2.1% | -- |
| 03/11/2022 03/11/22 | Rented | $2,400 | 0.0% | -- |
| 03/09/2022 03/09/22 | Under Contract | -- | -- | -- |
| 03/03/2022 03/03/22 | For Rent | $2,400 | 0.0% | -- |
| 02/25/2022 02/25/22 | Sold | $480,000 | +1.1% | $1,043 / Sq Ft |
| 01/23/2022 01/23/22 | Pending | -- | -- | -- |
| 01/20/2022 01/20/22 | For Sale | $475,000 | +11.2% | $1,033 / Sq Ft |
| 07/13/2018 07/13/18 | Sold | $427,000 | +7.0% | $928 / Sq Ft |
| 06/04/2018 06/04/18 | Pending | -- | -- | -- |
| 05/30/2018 05/30/18 | For Sale | $399,000 | 0.0% | $867 / Sq Ft |
| 05/12/2016 05/12/16 | Rented | $2,150 | 0.0% | -- |
| 05/09/2016 05/09/16 | Under Contract | -- | -- | -- |
| 05/03/2016 05/03/16 | Price Changed | $2,150 | -6.5% | $5 / Sq Ft |
| 04/20/2016 04/20/16 | For Rent | $2,300 | 0.0% | -- |
| 08/01/2014 08/01/14 | Sold | $315,000 | 0.0% | $685 / Sq Ft |
| 06/10/2014 06/10/14 | Pending | -- | -- | -- |
| 05/30/2014 05/30/14 | Off Market | $315,000 | -- | -- |
| 05/02/2014 05/02/14 | For Sale | $329,000 | 0.0% | $715 / Sq Ft |
| 08/01/2012 08/01/12 | Rented | $1,800 | 0.0% | -- |
| 07/02/2012 07/02/12 | Under Contract | -- | -- | -- |
| 03/21/2012 03/21/12 | For Rent | $1,800 | -- | -- |
Source: MLS Property Information Network (MLS PIN)
Tax History Compared to Growth
Tax History
| Year | Tax Paid | Tax Assessment Tax Assessment Total Assessment is a certain percentage of the fair market value that is determined by local assessors to be the total taxable value of land and additions on the property. | Land | Improvement |
|---|---|---|---|---|
| 2025 | $4,966 | $428,800 | $0 | $428,800 |
| 2024 | $4,697 | $430,900 | $0 | $430,900 |
| 2023 | $4,533 | $422,100 | $0 | $422,100 |
| 2022 | $4,201 | $386,100 | $0 | $386,100 |
| 2021 | $4,039 | $378,500 | $0 | $378,500 |
| 2020 | $3,639 | $344,600 | $0 | $344,600 |
| 2019 | $3,395 | $322,100 | $0 | $322,100 |
| 2018 | $3,214 | $306,700 | $0 | $306,700 |
| 2017 | $3,248 | $306,700 | $0 | $306,700 |
| 2016 | $3,183 | $289,400 | $0 | $289,400 |
| 2015 | $2,856 | $235,800 | $0 | $235,800 |
| 2014 | $2,648 | $210,500 | $0 | $210,500 |
Source: Public Records
Agents Affiliated with this Home
-
A
Seller's Agent in 2025
Anthony Coppola
Coldwell Banker Realty - Waltham
-
S
Buyer's Agent in 2025
Sandra McCarron
Capital Residential Group, LLC
-
J
Seller's Agent in 2023
Joseph Nardella
Compass
-
N
Buyer's Agent in 2023
Nicole Yoshikane
Keller Williams Realty Boston-Metro | Back Bay
-
D
Seller's Agent in 2022
Dante Bruzzese
Compass
-
C
Seller's Agent in 2022
Chris Tuite
Compass
Map
Source: MLS Property Information Network (MLS PIN)
MLS Number: 71673891
APN: SBOS-000000-000007-001944-000004
Disclaimer: Certain information contained herein is derived from information provided by parties other than Homes.com. All information provided is deemed reliable, but is not guaranteed to be accurate and should be independently verified.
![]() The property listing data and information, or the Images, set forth herein were provided to MLS Property Information Network, Inc. from third party sources, including sellers, lessors and public records, and were compiled by MLS Property Information Network, Inc. The property listing data and information, and the Images, are for the personal, non-commercial use of consumers having a good faith interest in purchasing or leasing listed properties of the type displayed to them and may not be used for any purpose other than to identify prospective properties which such consumers may have a good faith interest in purchasing or leasing. MLS Property Information Network, Inc. and its subscribers disclaim any and all representations and warranties as to the accuracy of the property listing data and information, or as to the accuracy of any of the Images, set forth herein.
The property listing data and information, or the Images, set forth herein were provided to MLS Property Information Network, Inc. from third party sources, including sellers, lessors and public records, and were compiled by MLS Property Information Network, Inc. The property listing data and information, and the Images, are for the personal, non-commercial use of consumers having a good faith interest in purchasing or leasing listed properties of the type displayed to them and may not be used for any purpose other than to identify prospective properties which such consumers may have a good faith interest in purchasing or leasing. MLS Property Information Network, Inc. and its subscribers disclaim any and all representations and warranties as to the accuracy of the property listing data and information, or as to the accuracy of any of the Images, set forth herein.
Nearby Homes
- 170 H St
- 178 H St
- 493 E 7th St
- 12 Springer St Unit 3
- 496 E 7th St Unit 1
- 511 E 8th St Unit 1
- 511 E 7th St
- 521 E 8th St Unit 6
- 5 Burrill Place
- 527 E 8th St
- 161 I St Unit 1
- 454-456 E 6th St
- 444 E 8th St Unit 1
- 59 Story St Unit 3
- 527 E 7th St Unit 3
- 527 E 7th St Unit 1
- 123 H St
- 511 E 5th St Unit 2R
- 511 E 5th St Unit 3R
- 511 E 5th St Unit 3F