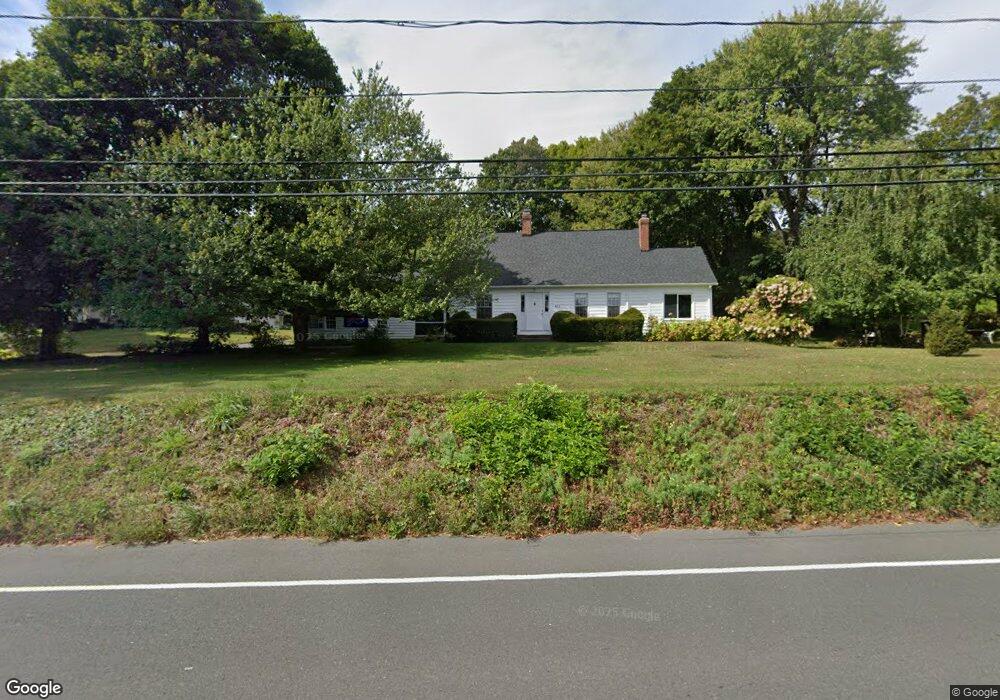
483 Fuller St Ludlow, MA 01056
Estimated Value: $355,434 - $473,000
3
Beds
2
Baths
1,956
Sq Ft
$212/Sq Ft
Est. Value
About This Home
This home is located at 483 Fuller St, Ludlow, MA 01056 and is currently estimated at $415,609, approximately $212 per square foot. 483 Fuller St is a home located in Hampden County with nearby schools including East Street Elementary School, Chapin Street Elementary School, and Paul R. Baird Middle School.
Ownership History
Date
Name
Owned For
Owner Type
Purchase Details
Closed on
Jan 23, 2018
Sold by
Borkowski David P and Borkowski Pamela S
Bought by
Borkowski Matthew F and Borkowski Daniel S
Current Estimated Value
Purchase Details
Closed on
Apr 7, 1986
Bought by
Borkowski David P and Borkowski Pamela S
Create a Home Valuation Report for This Property
The Home Valuation Report is an in-depth analysis detailing your home's value as well as a comparison with similar homes in the area
Home Values in the Area
Average Home Value in this Area
Purchase History
| Date | Buyer | Sale Price | Title Company |
|---|---|---|---|
| Borkowski Matthew F | -- | -- | |
| Borkowski David P | -- | -- |
Source: Public Records
Mortgage History
| Date | Status | Borrower | Loan Amount |
|---|---|---|---|
| Previous Owner | Borkowski David P | $50,000 | |
| Previous Owner | Borkowski David P | $40,000 | |
| Previous Owner | Borkowski David P | $33,000 | |
| Previous Owner | Borkowski David P | $55,000 |
Source: Public Records
Tax History
| Year | Tax Paid | Tax Assessment Tax Assessment Total Assessment is a certain percentage of the fair market value that is determined by local assessors to be the total taxable value of land and additions on the property. | Land | Improvement |
|---|---|---|---|---|
| 2025 | $4,856 | $279,900 | $97,200 | $182,700 |
| 2024 | $4,774 | $263,900 | $97,200 | $166,700 |
| 2023 | $4,515 | $231,400 | $85,300 | $146,100 |
| 2022 | $4,314 | $215,800 | $85,300 | $130,500 |
| 2021 | $4,342 | $206,000 | $85,300 | $120,700 |
| 2020 | $4,161 | $201,800 | $84,000 | $117,800 |
| 2019 | $3,922 | $197,900 | $83,200 | $114,700 |
| 2018 | $3,680 | $193,600 | $83,200 | $110,400 |
| 2017 | $3,639 | $196,400 | $80,700 | $115,700 |
| 2016 | $3,372 | $186,000 | $74,700 | $111,300 |
| 2015 | $3,166 | $183,100 | $74,000 | $109,100 |
Source: Public Records
Map
Nearby Homes
- '0' Rood St
- 25 Fox Hill Rd
- 173 Colonial Dr
- 665 Center St Unit 706
- 420 West St
- 47 Kendall St
- 382 Holyoke St
- 5052 Booth St
- 676 Chapin St
- 350 West St Unit 3
- 350 West St Unit 19
- 482 Holyoke St
- 84 Chapin Greene Dr
- 70 Sroka Ln
- 102 Swan Ave
- 98 Fuller St Unit 32
- 37 Waters Edge Unit 37
- Lot 9 Old St W
- Lot 6 Old St W
- Lot 7 Old St W
- 3 Nash Hill Rd
- 10 Nash Hill Rd
- 7 Nash Hill Rd
- 2 Nash Hill Rd
- 11 Nash Hill Rd
- 0 Nash Hill Rd
- 488 Fuller St
- 491 Fuller St
- 476 Fuller St Unit 478
- 15 Nash Hill Rd
- 490 Fuller St
- 493 Fuller St
- 480 Fuller St
- 25 Nash Hill Rd Unit 27
- 2527 Nash Hill Rd
- 22 Nash Hill Rd
- 460 Fuller St
- 498 Fuller St
- 31 Nash Hill Rd
- 28 Nash Hill Rd
Your Personal Tour Guide
Ask me questions while you tour the home.