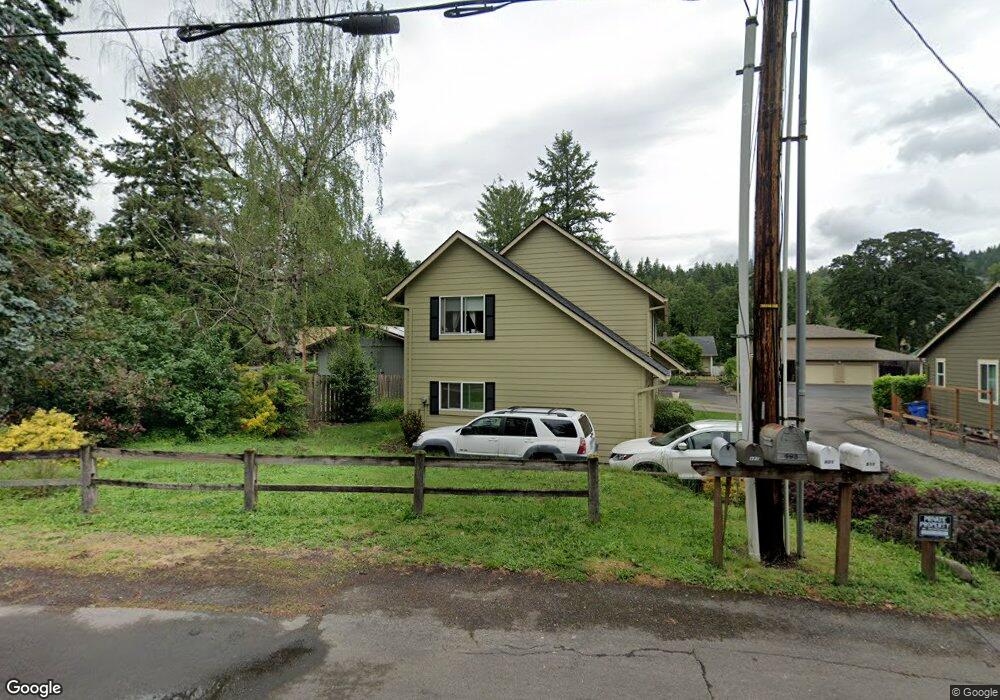
483 K St Washougal, WA 98671
Estimated Value: $581,863 - $674,000
6
Beds
2
Baths
2,208
Sq Ft
$283/Sq Ft
Est. Value
About This Home
This home is located at 483 K St, Washougal, WA 98671 and is currently estimated at $625,216, approximately $283 per square foot. 483 K St is a home located in Clark County with nearby schools including Hathaway Elementary School, Jemtegaard Middle School, and Washougal High School.
Ownership History
Date
Name
Owned For
Owner Type
Purchase Details
Closed on
Dec 15, 2016
Sold by
Vesber David B
Bought by
Tye Maynard E
Current Estimated Value
Home Financials for this Owner
Home Financials are based on the most recent Mortgage that was taken out on this home.
Original Mortgage
$155,000
Outstanding Balance
$126,755
Interest Rate
3.94%
Mortgage Type
New Conventional
Estimated Equity
$498,461
Purchase Details
Closed on
Feb 27, 2006
Sold by
Vesber David B
Bought by
Vesber David B
Create a Home Valuation Report for This Property
The Home Valuation Report is an in-depth analysis detailing your home's value as well as a comparison with similar homes in the area
Home Values in the Area
Average Home Value in this Area
Purchase History
| Date | Buyer | Sale Price | Title Company |
|---|---|---|---|
| Tye Maynard E | $335,000 | Fidelity Title Fl Vancouver | |
| Vesber David B | -- | None Available |
Source: Public Records
Mortgage History
| Date | Status | Borrower | Loan Amount |
|---|---|---|---|
| Open | Tye Maynard E | $155,000 |
Source: Public Records
Tax History Compared to Growth
Tax History
| Year | Tax Paid | Tax Assessment Tax Assessment Total Assessment is a certain percentage of the fair market value that is determined by local assessors to be the total taxable value of land and additions on the property. | Land | Improvement |
|---|---|---|---|---|
| 2025 | $5,230 | $469,830 | $115,068 | $354,762 |
| 2024 | $4,802 | $551,397 | $158,794 | $392,603 |
| 2023 | $4,672 | $529,786 | $158,794 | $370,992 |
| 2022 | $4,566 | $504,687 | $151,890 | $352,797 |
| 2021 | $4,216 | $428,001 | $133,479 | $294,522 |
| 2020 | $3,711 | $370,874 | $120,821 | $250,053 |
| 2019 | $3,669 | $331,564 | $115,068 | $216,496 |
| 2018 | $4,330 | $346,625 | $0 | $0 |
| 2017 | $3,137 | $337,647 | $0 | $0 |
| 2016 | $2,873 | $268,672 | $0 | $0 |
| 2015 | $2,712 | $224,948 | $0 | $0 |
| 2014 | -- | $211,263 | $0 | $0 |
| 2013 | -- | $161,903 | $0 | $0 |
Source: Public Records
Map
Nearby Homes