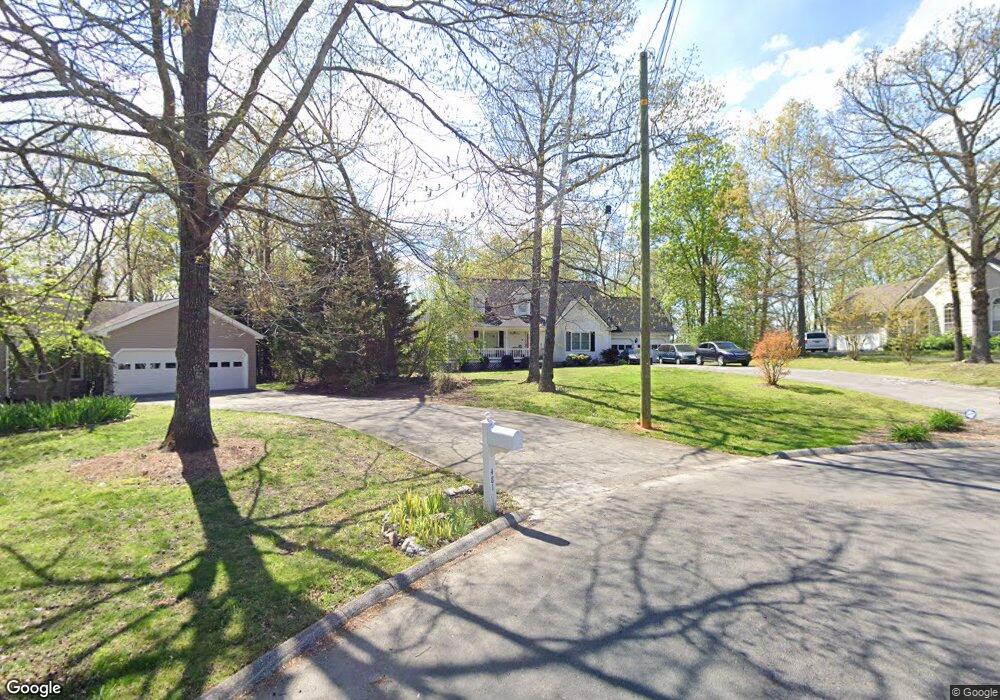
483 Lennox Way Rocky Face, GA 30740
Estimated Value: $313,294 - $394,000
3
Beds
3
Baths
2,045
Sq Ft
$168/Sq Ft
Est. Value
About This Home
This home is located at 483 Lennox Way, Rocky Face, GA 30740 and is currently estimated at $344,574, approximately $168 per square foot. 483 Lennox Way is a home located in Whitfield County with nearby schools including Tunnel Hill Elementary School, Westside Middle School, and Northwest Whitfield County High School.
Ownership History
Date
Name
Owned For
Owner Type
Purchase Details
Closed on
Mar 30, 2011
Sold by
Lampkin Kenneth A
Bought by
Lampkin Kenneth A
Current Estimated Value
Purchase Details
Closed on
Dec 12, 2008
Sold by
Cross Donny Paul
Bought by
Lampkin Kenneth A
Home Financials for this Owner
Home Financials are based on the most recent Mortgage that was taken out on this home.
Original Mortgage
$139,200
Interest Rate
6.1%
Mortgage Type
New Conventional
Purchase Details
Closed on
May 16, 2003
Sold by
Arp Lynelle R
Bought by
Cross Danny Paul and Cross Melinda J
Purchase Details
Closed on
Aug 1, 1993
Bought by
Arp Lynelle R
Create a Home Valuation Report for This Property
The Home Valuation Report is an in-depth analysis detailing your home's value as well as a comparison with similar homes in the area
Home Values in the Area
Average Home Value in this Area
Purchase History
| Date | Buyer | Sale Price | Title Company |
|---|---|---|---|
| Lampkin Kenneth A | -- | -- | |
| Lampkin Kenneth A | $174,000 | -- | |
| Cross Danny Paul | $161,500 | -- | |
| Arp Lynelle R | $92,900 | -- |
Source: Public Records
Mortgage History
| Date | Status | Borrower | Loan Amount |
|---|---|---|---|
| Previous Owner | Lampkin Kenneth A | $139,200 |
Source: Public Records
Tax History Compared to Growth
Tax History
| Year | Tax Paid | Tax Assessment Tax Assessment Total Assessment is a certain percentage of the fair market value that is determined by local assessors to be the total taxable value of land and additions on the property. | Land | Improvement |
|---|---|---|---|---|
| 2024 | $2,550 | $128,704 | $13,000 | $115,704 |
| 2023 | $2,550 | $92,053 | $13,000 | $79,053 |
| 2022 | $1,796 | $69,463 | $14,300 | $55,163 |
| 2021 | $1,797 | $69,463 | $14,300 | $55,163 |
| 2020 | $1,672 | $63,739 | $13,000 | $50,739 |
| 2019 | $1,694 | $63,739 | $13,000 | $50,739 |
| 2018 | $1,627 | $60,939 | $10,200 | $50,739 |
| 2017 | $1,628 | $60,939 | $10,200 | $50,739 |
| 2016 | $1,415 | $55,535 | $8,800 | $46,735 |
| 2014 | $1,421 | $60,176 | $6,300 | $53,876 |
| 2013 | -- | $60,176 | $6,300 | $53,876 |
Source: Public Records
Map
Nearby Homes
- 3038 Chattanooga Rd
- 823 Bridges Rd
- 827 Bridges Rd
- 250 Pinnacle Pointe Dr Unit 22
- 135 Buster Way
- 130 Jocelyn Way
- 1105 Mcclure Dr
- Lot 38 Keys Battery Ln
- Lot 42 Keys Battery Ln
- Lot 39 Keys Battery Ln
- 00 Chattanooga Rd
- 1127 Mount Vernon Rd
- Lot 30 Pat Cleburne Ln
- Lot 37 Pat Cleburne Ln
- 1113 Mount Vernon Rd
- 191 Mayfield Dr
- 1098 Mount Vernon Rd
- 966 Mount Vernon Rd
- 0 Chattanooga Rd
- 0 Chattanooga Rd Unit 1516834
- 485 Lennox Way
- 482 Lennox Way
- 487 Lennox Way
- 486 Lennox Way
- 484 Lennox Way
- 488 Lennox Way
- 489 Lennox Way
- 184 Providence Way
- 490 Lennox Way
- 510 Stratford Place
- 508 Stratford Place
- 506 Stratford Place
- 491 Lennox Way
- 492 Lennox Way
- 512 Stratford Place
- 504 Stratford Place
- 501 Stratford Place
- 0 Lennox Way
- 245 Rock Hill Dr
- 245 Rock Hill Dr Unit 113