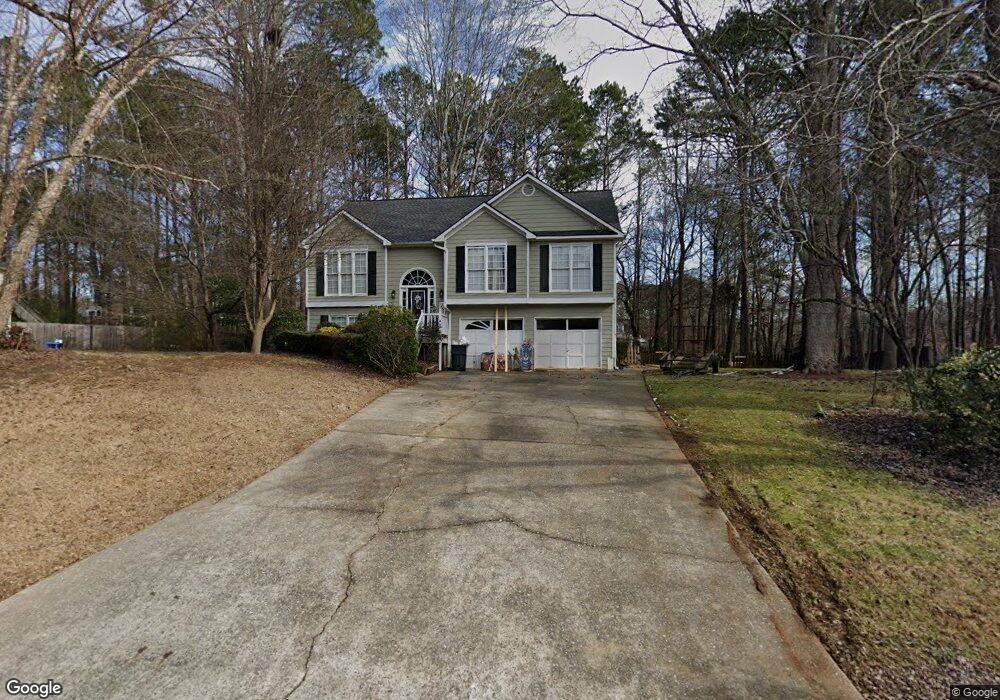
483 Maplewood Ln Acworth, GA 30101
Cedarcrest NeighborhoodEstimated Value: $349,000 - $365,000
3
Beds
2
Baths
1,429
Sq Ft
$249/Sq Ft
Est. Value
About This Home
This home is located at 483 Maplewood Ln, Acworth, GA 30101 and is currently estimated at $355,613, approximately $248 per square foot. 483 Maplewood Ln is a home located in Paulding County with nearby schools including Roland W. Russom Elementary School, East Paulding Middle School, and North Paulding High School.
Ownership History
Date
Name
Owned For
Owner Type
Purchase Details
Closed on
Jun 12, 2003
Sold by
Peppers Peppers H and Peppers Sharon S
Bought by
Howard John R and Howard Amelia
Current Estimated Value
Home Financials for this Owner
Home Financials are based on the most recent Mortgage that was taken out on this home.
Original Mortgage
$152,000
Outstanding Balance
$66,100
Interest Rate
5.68%
Mortgage Type
New Conventional
Estimated Equity
$289,513
Purchase Details
Closed on
Feb 25, 1999
Sold by
Catalano Daniel R and Catalano Donna M
Bought by
Peppers H Ray
Home Financials for this Owner
Home Financials are based on the most recent Mortgage that was taken out on this home.
Original Mortgage
$117,370
Interest Rate
6.79%
Mortgage Type
New Conventional
Create a Home Valuation Report for This Property
The Home Valuation Report is an in-depth analysis detailing your home's value as well as a comparison with similar homes in the area
Home Values in the Area
Average Home Value in this Area
Purchase History
| Date | Buyer | Sale Price | Title Company |
|---|---|---|---|
| Howard John R | $152,000 | -- | |
| Peppers H Ray | $121,000 | -- |
Source: Public Records
Mortgage History
| Date | Status | Borrower | Loan Amount |
|---|---|---|---|
| Open | Howard John R | $152,000 | |
| Previous Owner | Peppers H Ray | $117,370 |
Source: Public Records
Tax History Compared to Growth
Tax History
| Year | Tax Paid | Tax Assessment Tax Assessment Total Assessment is a certain percentage of the fair market value that is determined by local assessors to be the total taxable value of land and additions on the property. | Land | Improvement |
|---|---|---|---|---|
| 2024 | $3,291 | $135,520 | $18,000 | $117,520 |
| 2023 | $3,686 | $143,916 | $12,000 | $131,916 |
| 2022 | $2,859 | $111,556 | $12,000 | $99,556 |
| 2021 | $2,542 | $89,320 | $12,000 | $77,320 |
| 2020 | $2,537 | $87,272 | $12,000 | $75,272 |
| 2019 | $2,394 | $81,324 | $12,000 | $69,324 |
| 2018 | $2,056 | $68,236 | $12,000 | $56,236 |
| 2017 | $1,952 | $65,772 | $12,000 | $53,772 |
Source: Public Records
Map
Nearby Homes
- 195 Maplelake Dr
- 430 Maplewood Ln
- 107 Stonewood Creek Dr
- 6351 Granbury Walk NW
- 252 Stonewood Creek Dr
- 6321 Cheatham Lake Dr NW
- 2729 Cheatham Ct NW
- 6412 Old Stilesboro Rd NW
- 90 Old Stilesboro Rd NW
- 77 Rushing Creek Trail
- 49 Boxwood Way
- 137 Boxwood Way
- 645 Old Dallas Acworth Rd N
- 687 Belmont Ln
- 213 Elivia Way
- 214 Elivia Way
- 100 Crown Vista Way
- The Everleigh Plan at Madeira
- 511 Maplewood Ln
- 467 Maplewood Ln
- 130 Maplewood Cove
- 132 Maplewood Cove
- 227 Maplelake Dr
- 496 Maplewood Ln
- 474 Maplewood Ln
- 441 Maplewood Ln Unit 150
- 441 Maplewood Ln
- 508 Maplewood Ln
- 452 Maplewood Ln
- 136 Maplewood Cove
- 249 Maplelake Dr
- 149 Maplelake Dr
- 417 Maplewood Ln
- 94 Maplewood Cove
- 269 Maplelake Dr
- 210 Maplelake Dr
- 186 Maplelake Dr
- 145 Maplewood Cove