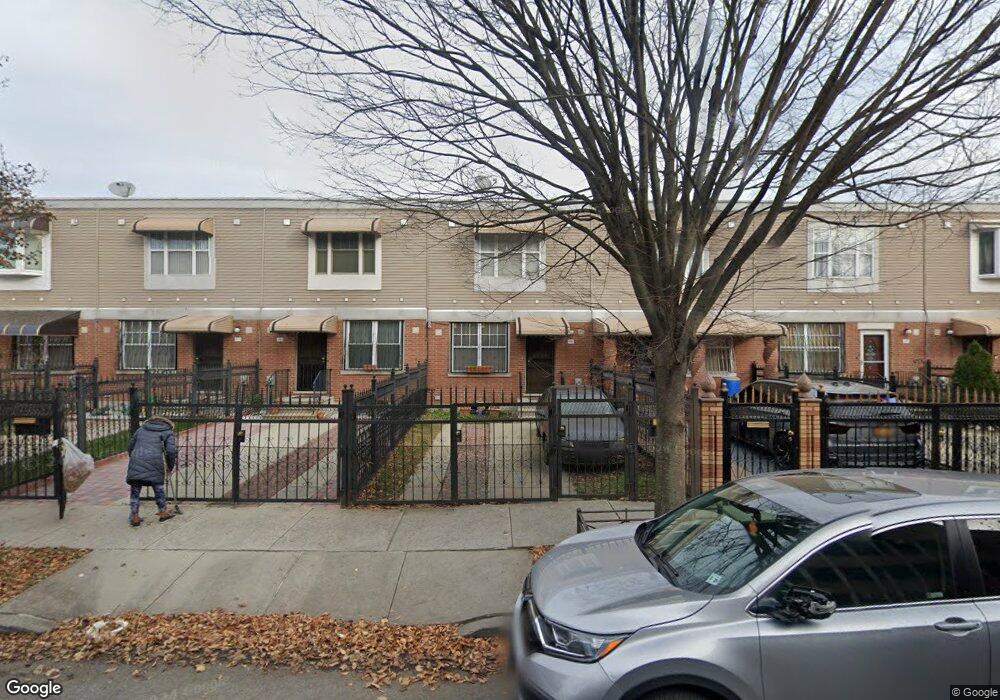
483 Osborn St Brooklyn, NY 11212
Brownsville NeighborhoodEstimated Value: $588,746 - $730,000
Studio
--
Bath
1,260
Sq Ft
$502/Sq Ft
Est. Value
About This Home
This home is located at 483 Osborn St, Brooklyn, NY 11212 and is currently estimated at $632,187, approximately $501 per square foot. 483 Osborn St is a home located in Kings County with nearby schools including P.S. 165 Ida Posner, P.S. 150 - Christopher, and P.S. 156 Waverly.
Ownership History
Date
Name
Owned For
Owner Type
Purchase Details
Closed on
Oct 29, 2003
Sold by
Nehemiah Housing Development Fund Compan
Bought by
Symmonds Gillian Dawn
Current Estimated Value
Home Financials for this Owner
Home Financials are based on the most recent Mortgage that was taken out on this home.
Original Mortgage
$80,000
Interest Rate
5.89%
Mortgage Type
Purchase Money Mortgage
Create a Home Valuation Report for This Property
The Home Valuation Report is an in-depth analysis detailing your home's value as well as a comparison with similar homes in the area
Home Values in the Area
Average Home Value in this Area
Purchase History
| Date | Buyer | Sale Price | Title Company |
|---|---|---|---|
| Symmonds Gillian Dawn | $105,000 | -- |
Source: Public Records
Mortgage History
| Date | Status | Borrower | Loan Amount |
|---|---|---|---|
| Previous Owner | Symmonds Gillian Dawn | $80,000 | |
| Closed | Symmonds Gillian Dawn | $20,000 |
Source: Public Records
Tax History
| Year | Tax Paid | Tax Assessment Tax Assessment Total Assessment is a certain percentage of the fair market value that is determined by local assessors to be the total taxable value of land and additions on the property. | Land | Improvement |
|---|---|---|---|---|
| 2025 | $3,654 | $37,560 | $15,420 | $22,140 |
| 2024 | $3,654 | $44,220 | $15,420 | $28,800 |
| 2023 | $3,147 | $45,540 | $15,420 | $30,120 |
| 2022 | $2,679 | $41,580 | $15,420 | $26,160 |
| 2021 | $2,575 | $34,140 | $15,420 | $18,720 |
| 2020 | $1,160 | $28,560 | $15,420 | $13,140 |
| 2019 | $2,053 | $27,240 | $15,420 | $11,820 |
| 2018 | $1,523 | $19,145 | $7,798 | $11,347 |
| 2017 | $1,069 | $18,062 | $6,715 | $11,347 |
| 2016 | $828 | $17,040 | $5,693 | $11,347 |
| 2015 | $558 | $17,520 | $5,693 | $11,827 |
| 2014 | $558 | $17,520 | $5,693 | $11,827 |
Source: Public Records
Map
Nearby Homes
- 797 Mother Gaston Blvd
- 524 Chester St
- 699 Sackman St
- 546 Powell St
- 625 Sackman St
- 502 Powell St
- 923 Rockaway Ave
- 555 Christopher Ave
- 592 Powell St
- 578 Christopher Ave
- 124 Lott Ave
- 931 Thomas S Boyland St
- 898 Thomas S Boyland St
- 106 Newport St
- 892 Mother Gaston Blvd
- 772 Thomas S Boyland St
- 385 Amboy St
- 121 Riverdale Ave
- 664 Osborn St Unit 1
- 533 Snediker Ave
Your Personal Tour Guide
Ask me questions while you tour the home.