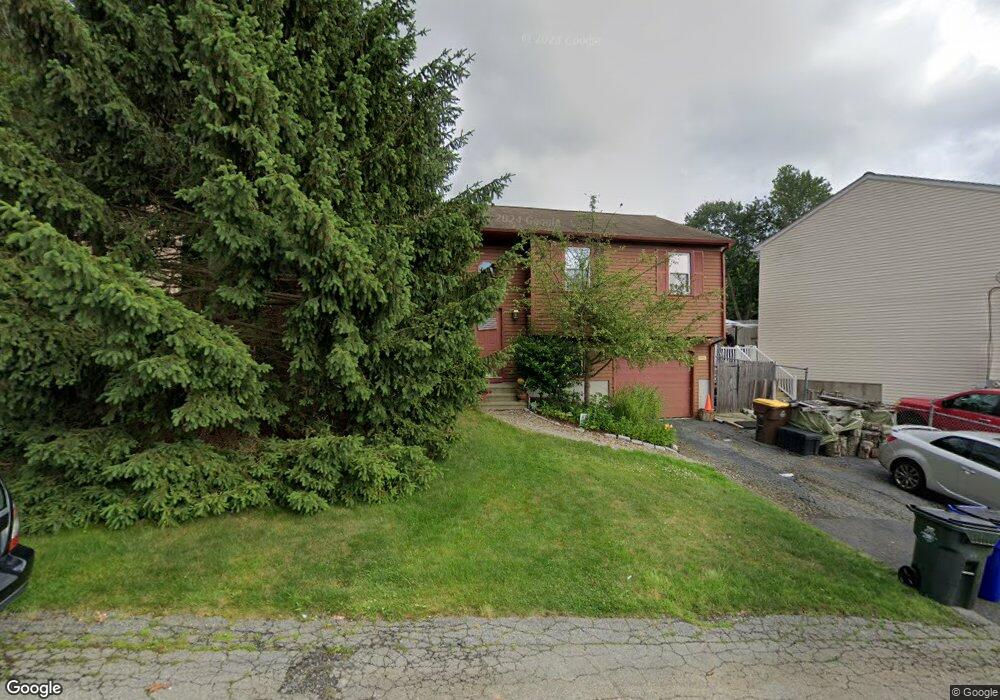
483 Quincy St Fall River, MA 02720
Western Fall River NeighborhoodEstimated Value: $419,000 - $487,000
3
Beds
2
Baths
1,160
Sq Ft
$388/Sq Ft
Est. Value
About This Home
This home is located at 483 Quincy St, Fall River, MA 02720 and is currently estimated at $450,386, approximately $388 per square foot. 483 Quincy St is a home located in Bristol County with nearby schools including North End Elementary School, Morton Middle School, and B M C Durfee High School.
Ownership History
Date
Name
Owned For
Owner Type
Purchase Details
Closed on
Nov 16, 1992
Sold by
Azevedo Manuel
Bought by
Perry Ernest E and Perry Gail M
Current Estimated Value
Home Financials for this Owner
Home Financials are based on the most recent Mortgage that was taken out on this home.
Original Mortgage
$103,500
Interest Rate
7.88%
Mortgage Type
Purchase Money Mortgage
Create a Home Valuation Report for This Property
The Home Valuation Report is an in-depth analysis detailing your home's value as well as a comparison with similar homes in the area
Home Values in the Area
Average Home Value in this Area
Purchase History
| Date | Buyer | Sale Price | Title Company |
|---|---|---|---|
| Perry Ernest E | $115,000 | -- |
Source: Public Records
Mortgage History
| Date | Status | Borrower | Loan Amount |
|---|---|---|---|
| Closed | Perry Ernest E | $103,500 |
Source: Public Records
Tax History Compared to Growth
Tax History
| Year | Tax Paid | Tax Assessment Tax Assessment Total Assessment is a certain percentage of the fair market value that is determined by local assessors to be the total taxable value of land and additions on the property. | Land | Improvement |
|---|---|---|---|---|
| 2025 | $4,049 | $353,600 | $117,000 | $236,600 |
| 2024 | $3,727 | $324,400 | $114,700 | $209,700 |
| 2023 | $3,483 | $283,900 | $103,300 | $180,600 |
| 2022 | $3,206 | $251,900 | $97,500 | $154,400 |
| 2021 | $3,206 | $231,800 | $93,100 | $138,700 |
| 2020 | $3,172 | $219,500 | $88,900 | $130,600 |
| 2019 | $3,259 | $223,500 | $92,900 | $130,600 |
| 2018 | $3,186 | $217,900 | $93,600 | $124,300 |
| 2017 | $2,990 | $213,600 | $93,600 | $120,000 |
| 2016 | $2,763 | $202,700 | $96,400 | $106,300 |
| 2015 | $2,689 | $205,600 | $96,400 | $109,200 |
| 2014 | $2,586 | $205,600 | $96,400 | $109,200 |
Source: Public Records
Map
Nearby Homes
- 104 Corbett St
- 2022-2030 Highland Ave
- 172 Gibbs St
- 3216 N Main St
- 3226 N Main St Unit 1
- Parcel 2 Highcrest Rd
- 1810 Highland Ave Unit 22
- 120 Terri Marie Way Unit 5-13
- 50 Clark St Unit 19
- 203 Martha St
- 409 Crescent St
- 1146 Ray St
- 120 Lewin St Unit 30
- 280 Joseph Dr
- 29 Valentine St
- 274 Archer St
- 410 Joseph Dr
- 439 Archer St
- 26 Goddard St
- 3682 N Main St Unit 7
- 499 Quincy St
- 451 Quincy St
- 204 Haskell St
- 166 Haskell St
- 478 Quincy St
- 478 Quincy St Unit C
- 478 Quincy St Unit 3
- 478 Quincy St Unit 1N
- 456 Quincy St
- 444 Quincy St
- 444 Quincy St Unit B
- 444 Quincy St Unit A
- 444 Quincy St Unit C
- 492 Quincy St
- 492 Quincy St Unit 3
- 492 Quincy St Unit 2
- 492 Quincy St Unit 1
- 150 Haskell St
- 504 Quincy St Unit 504 Quincy St.
- 504 Quincy St Unit B