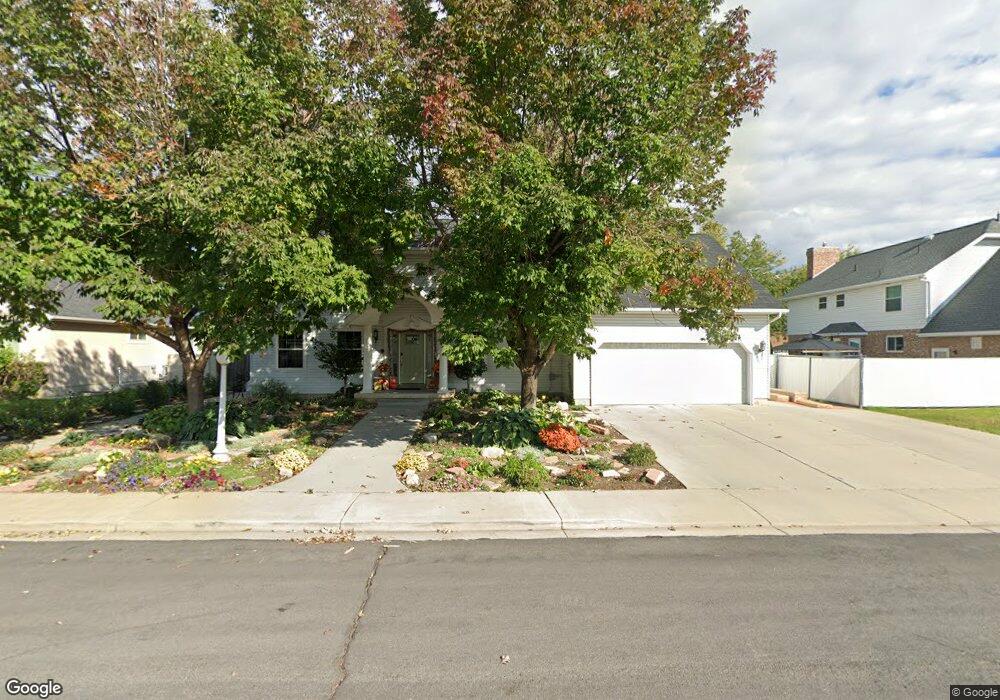
483 S 320 W Orem, UT 84058
Orem South NeighborhoodEstimated Value: $514,000 - $662,000
3
Beds
3
Baths
2,728
Sq Ft
$218/Sq Ft
Est. Value
About This Home
This home is located at 483 S 320 W, Orem, UT 84058 and is currently estimated at $593,784, approximately $217 per square foot. 483 S 320 W is a home located in Utah County with nearby schools including Orem Elementary School, Lakeridge Jr High School, and Mountain View High School.
Ownership History
Date
Name
Owned For
Owner Type
Purchase Details
Closed on
Mar 19, 2020
Sold by
Hafen Mark D and Hafen Kathy J
Bought by
Hafen Mark D and Hafen Kathy S
Current Estimated Value
Purchase Details
Closed on
Jan 11, 2010
Sold by
Stewart Kathaleen Joyce
Bought by
Stewart Kathaleen Joyce
Purchase Details
Closed on
Nov 16, 1998
Sold by
Stewart Kathaleen J
Bought by
Stewart Kathaleen J and Hafen Mark D
Home Financials for this Owner
Home Financials are based on the most recent Mortgage that was taken out on this home.
Original Mortgage
$191,700
Interest Rate
6.6%
Purchase Details
Closed on
Oct 27, 1998
Sold by
Stewart Kathaleen J
Bought by
Stewart Kathaleen J
Home Financials for this Owner
Home Financials are based on the most recent Mortgage that was taken out on this home.
Original Mortgage
$191,700
Interest Rate
6.6%
Create a Home Valuation Report for This Property
The Home Valuation Report is an in-depth analysis detailing your home's value as well as a comparison with similar homes in the area
Home Values in the Area
Average Home Value in this Area
Purchase History
| Date | Buyer | Sale Price | Title Company |
|---|---|---|---|
| Hafen Mark D | -- | None Available | |
| Stewart Kathaleen Joyce | -- | None Available | |
| Stewart Kathaleen J | -- | -- | |
| Stewart Kathaleen J | -- | Signature Title |
Source: Public Records
Mortgage History
| Date | Status | Borrower | Loan Amount |
|---|---|---|---|
| Closed | Stewart Kathaleen J | $191,700 |
Source: Public Records
Tax History
| Year | Tax Paid | Tax Assessment Tax Assessment Total Assessment is a certain percentage of the fair market value that is determined by local assessors to be the total taxable value of land and additions on the property. | Land | Improvement |
|---|---|---|---|---|
| 2025 | $2,581 | $326,370 | -- | -- |
| 2024 | $2,581 | $315,645 | $0 | $0 |
| 2023 | $2,417 | $317,625 | $0 | $0 |
| 2022 | $2,744 | $349,360 | $0 | $0 |
| 2021 | $2,634 | $508,000 | $192,700 | $315,300 |
| 2020 | $2,469 | $467,900 | $167,600 | $300,300 |
| 2019 | $2,354 | $464,000 | $167,600 | $296,400 |
| 2018 | $2,094 | $394,400 | $131,900 | $262,500 |
| 2017 | $1,942 | $195,910 | $0 | $0 |
| 2016 | $2,064 | $192,005 | $0 | $0 |
| 2015 | $1,985 | $174,625 | $0 | $0 |
| 2014 | $1,760 | $154,165 | $0 | $0 |
Source: Public Records
Map
Nearby Homes
- 193 W 530 S
- 343 W 730 S
- 322 S 100 W
- 216 S 400 W
- 148 S 400 W
- 87 E 600 S Unit D
- 55 Hanover Dr
- 64 S 320 W
- 881 S 635 W
- 570 S 800 West St Unit 15
- 520 S 800 W Unit 14
- 842 S 50 E
- 506 S 800 West St Unit 13
- 747 Hanover Dr
- 139 E 800 S
- 62 N Garden Park Dr Unit 8
- 912 S 100 E
- 508 W 40 N
- 565 W 40 N
- 208 W Garden Park
Your Personal Tour Guide
Ask me questions while you tour the home.