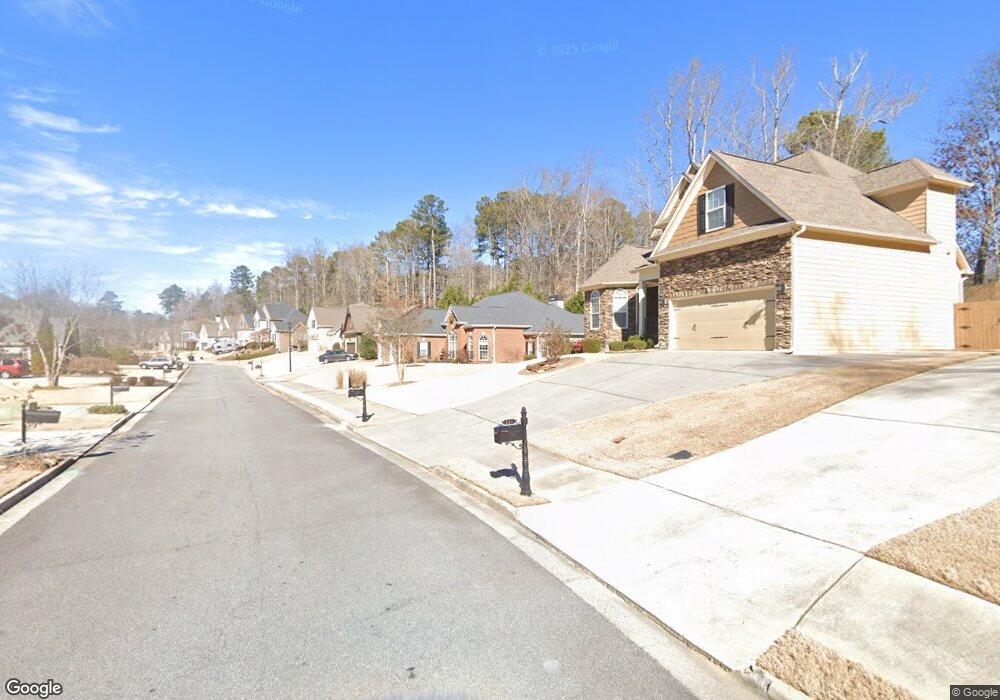
483 Thorn Creek Way Unit 71 Dallas, GA 30157
East Paulding County NeighborhoodEstimated Value: $449,250 - $523,000
3
Beds
3
Baths
2,557
Sq Ft
$192/Sq Ft
Est. Value
About This Home
This home is located at 483 Thorn Creek Way Unit 71, Dallas, GA 30157 and is currently estimated at $491,313, approximately $192 per square foot. 483 Thorn Creek Way Unit 71 is a home located in Paulding County with nearby schools including Mcgarity Elementary School, P. B. Ritch Middle School, and East Paulding High School.
Ownership History
Date
Name
Owned For
Owner Type
Purchase Details
Closed on
Jan 31, 2020
Sold by
Rickabaugh Larry W
Bought by
Collie Anthony Bartholomew and Collie Kathleen Ann
Current Estimated Value
Home Financials for this Owner
Home Financials are based on the most recent Mortgage that was taken out on this home.
Original Mortgage
$140,000
Outstanding Balance
$124,242
Interest Rate
3.72%
Mortgage Type
New Conventional
Estimated Equity
$367,071
Purchase Details
Closed on
Jan 11, 2017
Sold by
Not Provided
Bought by
Pinnacle Homes Of The South Ll
Purchase Details
Closed on
Jan 19, 2010
Sold by
Homesales Inc
Bought by
Rickabaugh Larry W and Rickabaugh Beverly L
Home Financials for this Owner
Home Financials are based on the most recent Mortgage that was taken out on this home.
Original Mortgage
$100,000
Interest Rate
4.8%
Mortgage Type
New Conventional
Purchase Details
Closed on
Jul 7, 2009
Sold by
Letchworth R Sean
Bought by
Homesales Inc
Create a Home Valuation Report for This Property
The Home Valuation Report is an in-depth analysis detailing your home's value as well as a comparison with similar homes in the area
Home Values in the Area
Average Home Value in this Area
Purchase History
| Date | Buyer | Sale Price | Title Company |
|---|---|---|---|
| Collie Anthony Bartholomew | $290,000 | -- | |
| Pinnacle Homes Of The South Ll | $136,250 | -- | |
| Rickabaugh Larry W | $153,000 | -- | |
| Homesales Inc | $138,184 | -- |
Source: Public Records
Mortgage History
| Date | Status | Borrower | Loan Amount |
|---|---|---|---|
| Open | Collie Anthony Bartholomew | $140,000 | |
| Previous Owner | Rickabaugh Larry W | $100,000 |
Source: Public Records
Tax History Compared to Growth
Tax History
| Year | Tax Paid | Tax Assessment Tax Assessment Total Assessment is a certain percentage of the fair market value that is determined by local assessors to be the total taxable value of land and additions on the property. | Land | Improvement |
|---|---|---|---|---|
| 2024 | $4,562 | $183,400 | $20,000 | $163,400 |
| 2023 | $4,904 | $188,112 | $20,000 | $168,112 |
| 2022 | $3,919 | $150,332 | $18,000 | $132,332 |
| 2021 | $3,371 | $122,580 | $18,000 | $104,580 |
| 2020 | $2,385 | $124,116 | $18,000 | $106,116 |
| 2019 | $2,091 | $107,480 | $18,000 | $89,480 |
| 2018 | $2,093 | $107,920 | $19,200 | $88,720 |
| 2017 | $1,943 | $98,720 | $19,200 | $79,520 |
| 2016 | $1,762 | $91,440 | $19,200 | $72,240 |
| 2015 | $2,747 | $91,120 | $19,200 | $71,920 |
| 2014 | $2,626 | $85,040 | $19,200 | $65,840 |
| 2013 | -- | $65,680 | $19,200 | $46,480 |
Source: Public Records
Map
Nearby Homes
- 453 Thorn Creek Way
- 443 Creekwood Pass
- 355 Thorn Creek Way
- 135 Powder Creek Dr
- 346 Thorn Creek Way
- 150 Doris Path
- 110 Doris Path
- 468 Crestview Dr Unit 2
- 308 Ryan Trail
- 88 Mount Vernon Dr
- 99 Rainwater Ln
- 107 Sedgefield Overlook
- 29 Sedgefield Overlook
- 2957 Charles Hardy Pkwy
- 176 Georgias Ln
- 19 Dartmoor Cir
- 42 Dartmoor Cir
- 483 Thorn Creek Way
- 483 Thorn Creek Way Unit 72
- 501 Thorn Creek Way
- 467 Thorn Creek Way Unit 70
- 544 Creekwood Pass
- 560 Creekwood Pass
- 517 Thorn Creek Way
- 504 Thorn Creek Way
- 472 Thorn Creek Way
- 439 Thorn Creek Way
- 462 Thorn Creek Way
- 492 Creekwood Pass Unit 2
- 436 Thorn Creek Way
- 528 Thorn Creek Way
- 415 Thorn Creek Way
- 562 Creekwood Pass
- 216 Powder Creek Dr
- 418 Thorn Creek Way
- 410 Thorn Creek Way
- 470 Creekwood Pass