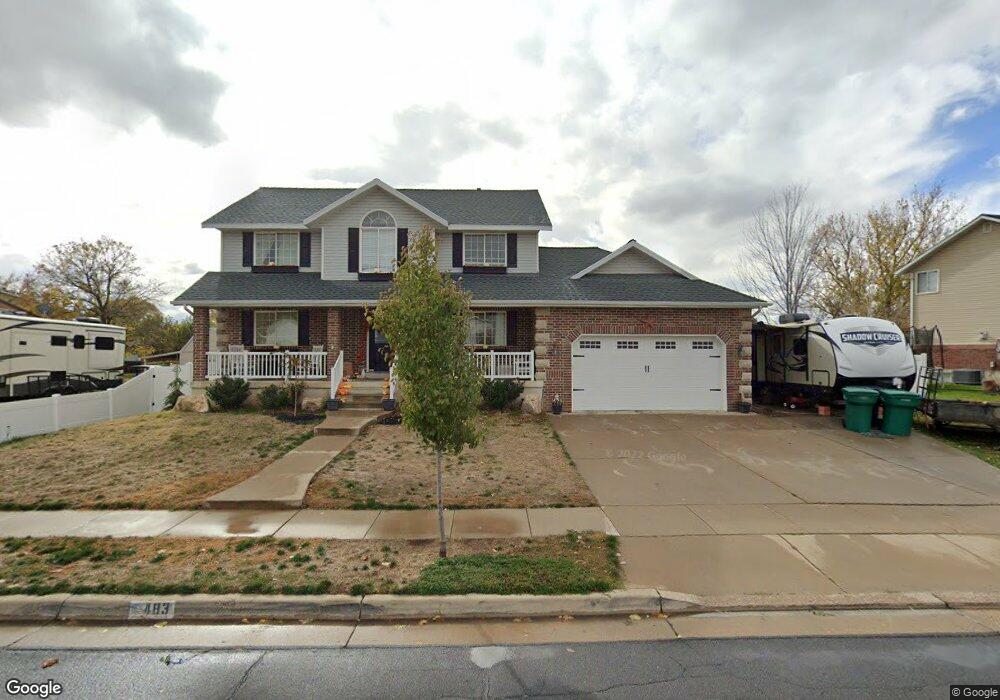
483 W 350 S Layton, UT 84041
Estimated Value: $518,000 - $591,344
5
Beds
4
Baths
2,766
Sq Ft
$205/Sq Ft
Est. Value
About This Home
This home is located at 483 W 350 S, Layton, UT 84041 and is currently estimated at $566,836, approximately $204 per square foot. 483 W 350 S is a home located in Davis County with nearby schools including Layton Elementary School, Fairfield Junior High School, and Layton High School.
Ownership History
Date
Name
Owned For
Owner Type
Purchase Details
Closed on
Sep 28, 2016
Sold by
Gulli Joseph M
Bought by
Gulli Joseph M and Gulli Emily M
Current Estimated Value
Purchase Details
Closed on
Sep 27, 2016
Sold by
Gibby Daniel L and Gibby Michelle R
Bought by
Gulli Joseph M
Purchase Details
Closed on
Jun 28, 2005
Sold by
Evans Gregory S and Evans Theresa S
Bought by
Gibby Daniel L and Gibby Michelle R
Home Financials for this Owner
Home Financials are based on the most recent Mortgage that was taken out on this home.
Original Mortgage
$211,900
Interest Rate
5.65%
Mortgage Type
Fannie Mae Freddie Mac
Purchase Details
Closed on
Nov 12, 1997
Sold by
Green L Dale
Bought by
Evans Gregory S and Evans Theresa S
Home Financials for this Owner
Home Financials are based on the most recent Mortgage that was taken out on this home.
Original Mortgage
$125,000
Interest Rate
7.3%
Purchase Details
Closed on
Feb 20, 1997
Sold by
Green Edward D and Dale Green L
Bought by
Green L Dale
Create a Home Valuation Report for This Property
The Home Valuation Report is an in-depth analysis detailing your home's value as well as a comparison with similar homes in the area
Home Values in the Area
Average Home Value in this Area
Purchase History
| Date | Buyer | Sale Price | Title Company |
|---|---|---|---|
| Gulli Joseph M | -- | Stewart Title | |
| Gulli Joseph M | -- | Stewart Title | |
| Gibby Daniel L | -- | Heritage West Title Ins Agen | |
| Evans Gregory S | -- | Security Title Company | |
| Green L Dale | -- | Security Title Company |
Source: Public Records
Mortgage History
| Date | Status | Borrower | Loan Amount |
|---|---|---|---|
| Previous Owner | Gibby Daniel L | $211,900 | |
| Previous Owner | Evans Gregory S | $125,000 |
Source: Public Records
Tax History Compared to Growth
Tax History
| Year | Tax Paid | Tax Assessment Tax Assessment Total Assessment is a certain percentage of the fair market value that is determined by local assessors to be the total taxable value of land and additions on the property. | Land | Improvement |
|---|---|---|---|---|
| 2024 | $2,752 | $290,950 | $122,114 | $168,836 |
| 2023 | $2,742 | $511,000 | $120,569 | $390,431 |
| 2022 | $2,951 | $298,650 | $75,579 | $223,071 |
| 2021 | $2,557 | $386,000 | $113,396 | $272,604 |
| 2020 | $2,313 | $335,000 | $95,327 | $239,673 |
| 2019 | $2,242 | $318,000 | $98,136 | $219,864 |
| 2018 | $2,051 | $292,000 | $86,036 | $205,964 |
| 2016 | $1,995 | $146,520 | $33,634 | $112,886 |
| 2015 | $1,895 | $132,165 | $33,634 | $98,531 |
| 2014 | $1,966 | $140,197 | $33,634 | $106,563 |
| 2013 | -- | $118,290 | $26,884 | $91,406 |
Source: Public Records
Map
Nearby Homes
- 267 S Melody St
- 562 S 850 W
- 485 W 100 N
- 750 W Gentile St
- 933 W Gentile St
- 774 W Farming Way
- 891 W 60 N
- 6 Grover St
- 189 S Main St Unit 21
- 189 S Main St Unit 76
- 302 E 900 S
- 282 E 925 S
- 1042 W Shoreline Dr
- 142 Green Dr
- 1071 Shoreline Dr
- 526 King St Unit 2
- 2060 W Phillips St
- 2056 W Phillips St
- 608 S Main St
- 444 Owens St