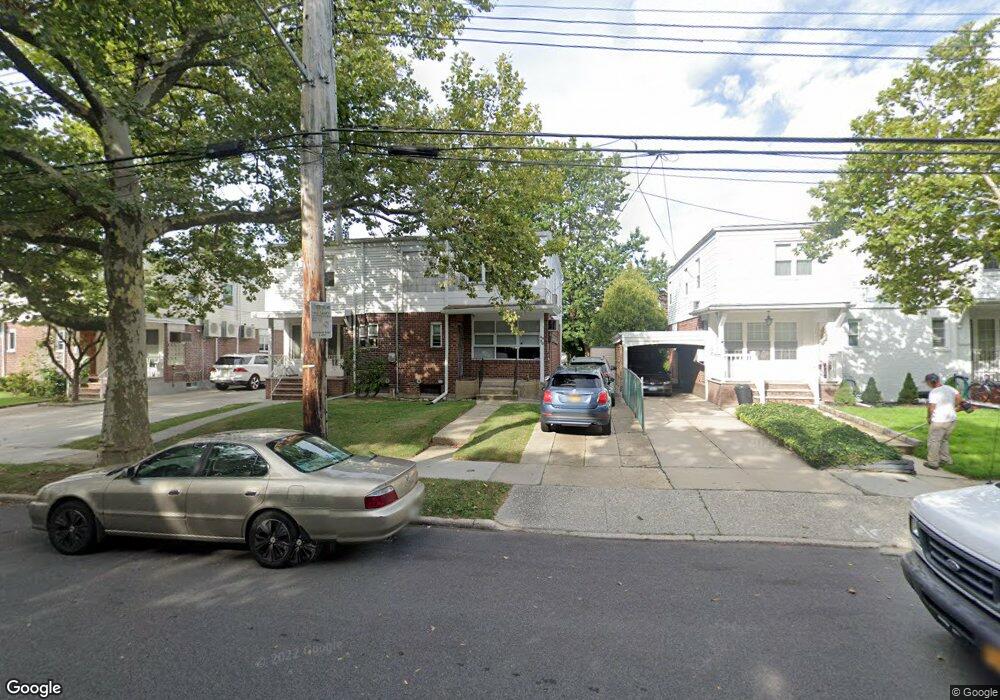
4830 Clearview Expy Oakland Gardens, NY 11364
Auburndale NeighborhoodEstimated Value: $870,000 - $940,000
--
Bed
--
Bath
1,224
Sq Ft
$729/Sq Ft
Est. Value
About This Home
This home is located at 4830 Clearview Expy, Oakland Gardens, NY 11364 and is currently estimated at $892,166, approximately $728 per square foot. 4830 Clearview Expy is a home located in Queens County with nearby schools including P.S. 162 The John Golden School, M.S. 158 - Marie Curie, and Francis Lewis High School.
Ownership History
Date
Name
Owned For
Owner Type
Purchase Details
Closed on
Jun 10, 2015
Sold by
Bookspan Linda and Kaplan Neil Zachary
Bought by
Kaplan Neil Zachary
Current Estimated Value
Purchase Details
Closed on
Nov 20, 1998
Sold by
Kaplan Neil and Kaplan Denise
Bought by
Kaplan Morris
Home Financials for this Owner
Home Financials are based on the most recent Mortgage that was taken out on this home.
Original Mortgage
$180,800
Interest Rate
10.5%
Purchase Details
Closed on
Jun 18, 1996
Sold by
Oci Mtg Corp
Bought by
Kaplan Neil and Kaplan Denise
Home Financials for this Owner
Home Financials are based on the most recent Mortgage that was taken out on this home.
Original Mortgage
$118,950
Interest Rate
12.75%
Create a Home Valuation Report for This Property
The Home Valuation Report is an in-depth analysis detailing your home's value as well as a comparison with similar homes in the area
Home Values in the Area
Average Home Value in this Area
Purchase History
| Date | Buyer | Sale Price | Title Company |
|---|---|---|---|
| Kaplan Neil Zachary | -- | -- | |
| Kaplan Neil Zachary | -- | -- | |
| Kaplan Morris | -- | Titleserv | |
| Kaplan Morris | -- | Titleserv | |
| Kaplan Neil | $130,000 | Commonwealth Land Title Ins | |
| Kaplan Neil | $130,000 | Commonwealth Land Title Ins |
Source: Public Records
Mortgage History
| Date | Status | Borrower | Loan Amount |
|---|---|---|---|
| Previous Owner | Kaplan Morris | $180,800 | |
| Previous Owner | Kaplan Neil | $118,950 |
Source: Public Records
Tax History Compared to Growth
Tax History
| Year | Tax Paid | Tax Assessment Tax Assessment Total Assessment is a certain percentage of the fair market value that is determined by local assessors to be the total taxable value of land and additions on the property. | Land | Improvement |
|---|---|---|---|---|
| 2025 | $7,231 | $38,164 | $8,270 | $29,894 |
| 2024 | $7,231 | $36,004 | $9,352 | $26,652 |
| 2023 | $6,822 | $33,967 | $8,059 | $25,908 |
| 2022 | $6,398 | $50,880 | $12,000 | $38,880 |
| 2021 | $6,745 | $49,080 | $12,000 | $37,080 |
| 2020 | $6,732 | $43,740 | $12,000 | $31,740 |
| 2019 | $6,276 | $47,940 | $12,000 | $35,940 |
| 2018 | $5,770 | $28,306 | $7,589 | $20,717 |
| 2017 | $5,444 | $26,707 | $7,429 | $19,278 |
| 2016 | $5,339 | $26,707 | $7,429 | $19,278 |
| 2015 | $3,039 | $26,503 | $10,377 | $16,126 |
| 2014 | $3,039 | $25,003 | $10,820 | $14,183 |
Source: Public Records
Map
Nearby Homes
- 48-35 Clearview Expy
- 48-18 202nd St
- 48-46 206th St Unit 2
- 4843 201st St
- 4732 207th St
- 46-38 204th St
- 204-19 46th Rd
- 46-27 206th St
- 4607 204th St
- 208-04 50th Ave
- 50-15 199th St
- 208-2 47th Ave
- 208-4 47th Ave
- 199-04 47th Ave
- 20222 45th Dr
- 206-50 46th Ave
- 5118 199th St
- 202-04 45th Dr
- 208-12 53rd Ave
- 206-41 46th Ave
- 4832 Clearview Expy
- 4826 Clearview Expy
- 48-32 Clearview Expy
- 4824 Clearview Expy
- 4836 Clearview Expy
- 4820 Clearview Expy
- 4838 Clearview Expy
- 4829 203rd St
- 4825 203rd St
- 4831 203rd St
- 4818 Clearview Expy
- 48-31 203rd St
- 4823 203rd St
- 4840 Clearview Expy
- 4831 203rd St
- 4835 203rd St
- 4823 203rd St
- 4823 203rd St
- 4819 203rd St
- 4814 Clearview Expy