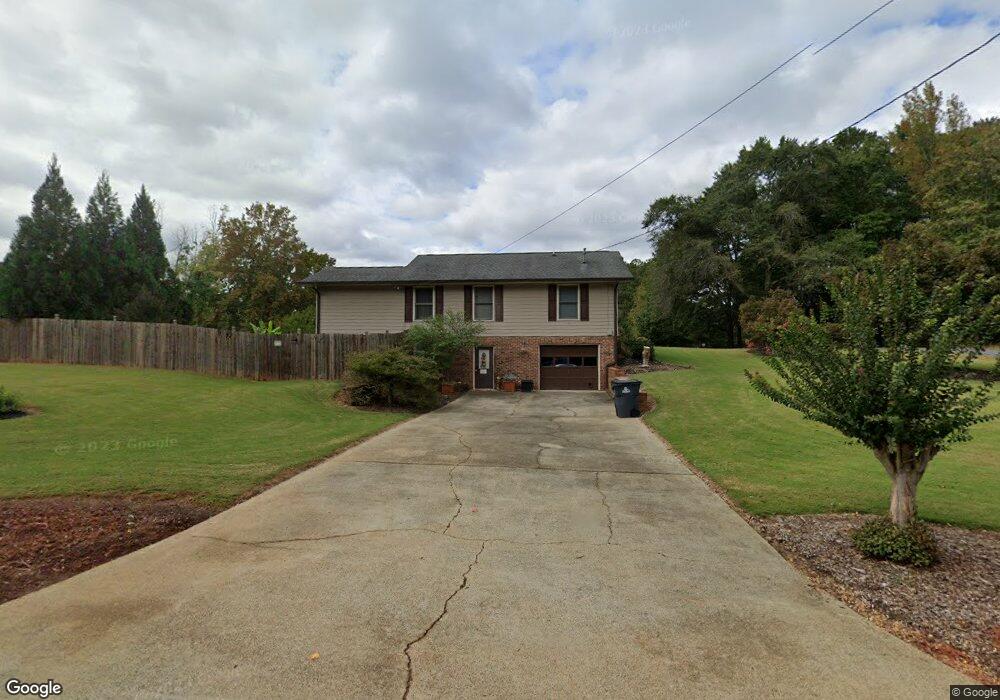
4830 Cove St Acworth, GA 30101
Estimated Value: $498,404 - $552,000
4
Beds
3
Baths
2,450
Sq Ft
$219/Sq Ft
Est. Value
About This Home
This home is located at 4830 Cove St, Acworth, GA 30101 and is currently estimated at $536,601, approximately $219 per square foot. 4830 Cove St is a home located in Cobb County with nearby schools including McCall Primary School, Acworth Intermediate School, and Barber Middle School.
Ownership History
Date
Name
Owned For
Owner Type
Purchase Details
Closed on
Jan 6, 2018
Sold by
Banks Lee Frazer
Bought by
Banks Patti Ann
Current Estimated Value
Purchase Details
Closed on
May 31, 2005
Sold by
Dilbeck James R and Dilbeck Shirley
Bought by
Banks Lee F
Home Financials for this Owner
Home Financials are based on the most recent Mortgage that was taken out on this home.
Original Mortgage
$235,600
Interest Rate
5.74%
Mortgage Type
New Conventional
Create a Home Valuation Report for This Property
The Home Valuation Report is an in-depth analysis detailing your home's value as well as a comparison with similar homes in the area
Home Values in the Area
Average Home Value in this Area
Purchase History
| Date | Buyer | Sale Price | Title Company |
|---|---|---|---|
| Banks Patti Ann | -- | -- | |
| Banks Lee F | $294,500 | -- |
Source: Public Records
Mortgage History
| Date | Status | Borrower | Loan Amount |
|---|---|---|---|
| Previous Owner | Banks Lee F | $235,600 |
Source: Public Records
Tax History Compared to Growth
Tax History
| Year | Tax Paid | Tax Assessment Tax Assessment Total Assessment is a certain percentage of the fair market value that is determined by local assessors to be the total taxable value of land and additions on the property. | Land | Improvement |
|---|---|---|---|---|
| 2025 | $1,183 | $158,108 | $24,800 | $133,308 |
| 2024 | $1,186 | $158,108 | $24,800 | $133,308 |
| 2023 | $980 | $158,108 | $24,800 | $133,308 |
| 2022 | $1,041 | $109,680 | $16,000 | $93,680 |
| 2021 | $1,041 | $109,680 | $16,000 | $93,680 |
| 2020 | $1,873 | $109,680 | $16,000 | $93,680 |
| 2019 | $1,012 | $99,892 | $16,000 | $83,892 |
| 2018 | $1,012 | $99,892 | $16,000 | $83,892 |
| 2017 | $2,577 | $99,892 | $16,000 | $83,892 |
| 2016 | $2,579 | $99,892 | $16,000 | $83,892 |
| 2015 | $2,606 | $98,260 | $16,960 | $81,300 |
| 2014 | $2,628 | $98,260 | $0 | $0 |
Source: Public Records
Map
Nearby Homes