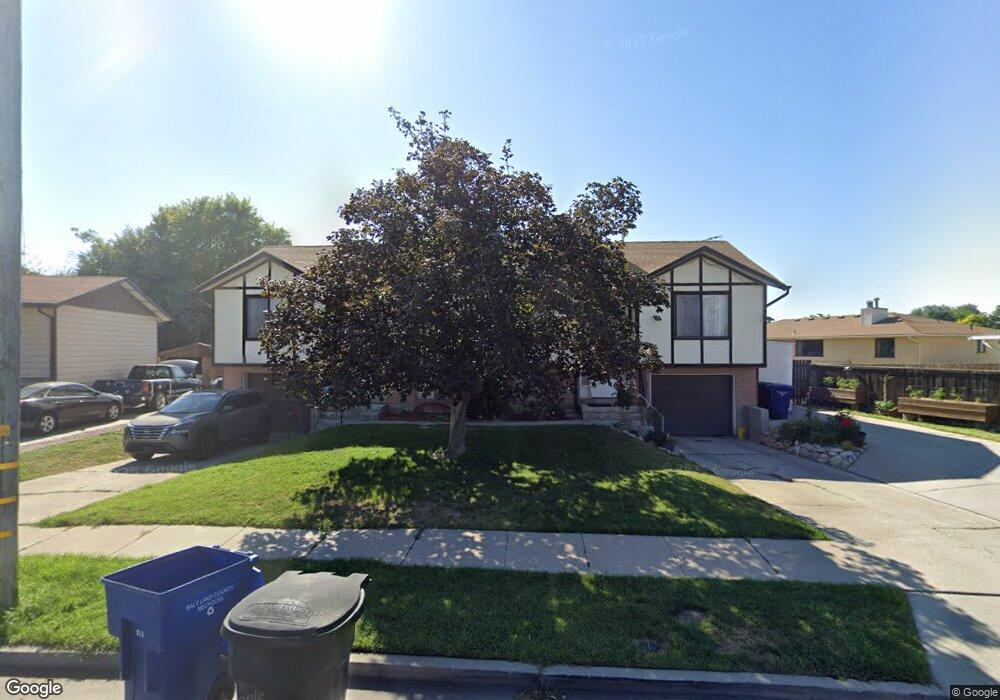
4830 S 1950 W Unit 4832 Salt Lake City, UT 84129
Estimated Value: $524,718 - $663,000
5
Beds
3
Baths
3,320
Sq Ft
$185/Sq Ft
Est. Value
About This Home
This home is located at 4830 S 1950 W Unit 4832, Salt Lake City, UT 84129 and is currently estimated at $614,930, approximately $185 per square foot. 4830 S 1950 W Unit 4832 is a home located in Salt Lake County with nearby schools including Vista Elementary School, Eisenhower Jr High School, and Taylorsville High School.
Ownership History
Date
Name
Owned For
Owner Type
Purchase Details
Closed on
May 17, 1999
Sold by
Degooyer Lonnie C and Degooyer Lanette E
Bought by
Richardson Stephen A and Richardson Laura
Current Estimated Value
Home Financials for this Owner
Home Financials are based on the most recent Mortgage that was taken out on this home.
Original Mortgage
$168,487
Outstanding Balance
$43,101
Interest Rate
6.92%
Mortgage Type
FHA
Estimated Equity
$571,829
Purchase Details
Closed on
Jan 29, 1999
Sold by
Draper John W
Bought by
Degooyer Lonnie C and Degooyer Lanette E
Home Financials for this Owner
Home Financials are based on the most recent Mortgage that was taken out on this home.
Original Mortgage
$80,000
Interest Rate
6.63%
Purchase Details
Closed on
Jan 31, 1994
Sold by
Draper John W
Bought by
Degooyer Lonnie C and Degooyer Lanette
Purchase Details
Closed on
Oct 5, 1993
Sold by
Draper Kevin D
Bought by
Draper John W and Draper Dolores C
Create a Home Valuation Report for This Property
The Home Valuation Report is an in-depth analysis detailing your home's value as well as a comparison with similar homes in the area
Home Values in the Area
Average Home Value in this Area
Purchase History
| Date | Buyer | Sale Price | Title Company |
|---|---|---|---|
| Richardson Stephen A | -- | United Title Services | |
| Degooyer Lonnie C | -- | First American Title | |
| Degooyer Lonnie C | $103,000 | -- | |
| Draper John W | -- | -- |
Source: Public Records
Mortgage History
| Date | Status | Borrower | Loan Amount |
|---|---|---|---|
| Open | Richardson Stephen A | $168,487 | |
| Previous Owner | Degooyer Lonnie C | $80,000 |
Source: Public Records
Tax History Compared to Growth
Tax History
| Year | Tax Paid | Tax Assessment Tax Assessment Total Assessment is a certain percentage of the fair market value that is determined by local assessors to be the total taxable value of land and additions on the property. | Land | Improvement |
|---|---|---|---|---|
| 2025 | $3,079 | $529,500 | $142,100 | $387,400 |
| 2024 | $3,079 | $504,900 | $135,300 | $369,600 |
| 2023 | $2,815 | $452,800 | $130,100 | $322,700 |
| 2022 | $2,803 | $454,900 | $127,500 | $327,400 |
| 2021 | $2,608 | $368,600 | $98,100 | $270,500 |
| 2020 | $2,505 | $335,000 | $98,100 | $236,900 |
| 2019 | $2,449 | $319,800 | $87,400 | $232,400 |
| 2018 | $2,495 | $314,100 | $87,400 | $226,700 |
| 2017 | $2,203 | $291,600 | $87,400 | $204,200 |
| 2016 | $1,912 | $252,900 | $87,400 | $165,500 |
| 2015 | $1,895 | $234,200 | $91,200 | $143,000 |
| 2014 | $1,851 | $224,700 | $88,500 | $136,200 |
Source: Public Records
Map
Nearby Homes
- 1904 W 4840 S
- 4866 Marianna Dr
- 4631 S 1980 W
- 2306 Bonniebrook Cir
- 4533 S Knightsbridge Rd
- 1475 W 4950 S
- 4497 S Edgeware Ln
- 2063 W Chateau Ave
- 1886 W Champagne Ave
- 2104 W Champagne Cir
- 1901 Kirkham Way
- 1338 W 4800 S
- 2218 W Mackay Ln
- 2604 W West Central Park Way
- 2016 W Hew Wood Ct
- 4545 S Thornwood Ave
- 2752 Santex Cir
- 2658 W Scarsdale Ct Unit 49
- 1224 W 4800 S
- 5020 S 1250 W
- 4838 S 1950 W Unit 4840
- 1957 Quailstone Dr
- 4816 S 1950 W Unit 4818
- 4831 Quailstone Cir
- 4831 S Quailstone Cir
- 1971 Quailstone Dr
- 4837 S Quailstone Cir
- 4837 Quailstone Cir
- 4848 S 1950 W
- 1989 W Quailstone Dr
- 1989 Quailstone Dr
- 1928 W 4840 S
- 4847 S 1950 W
- 4839 Quailstone Cir
- 1917 W 4805 S
- 4825 Quailstone Cir
- 4825 S Quailstone Cir
- 4797 S Quailbrook Dr
- 4797 Quailbrook Dr
- 1946 W Quailstone Dr