Estimated Value: $543,000 - $558,000
5
Beds
4
Baths
2,382
Sq Ft
$230/Sq Ft
Est. Value
About This Home
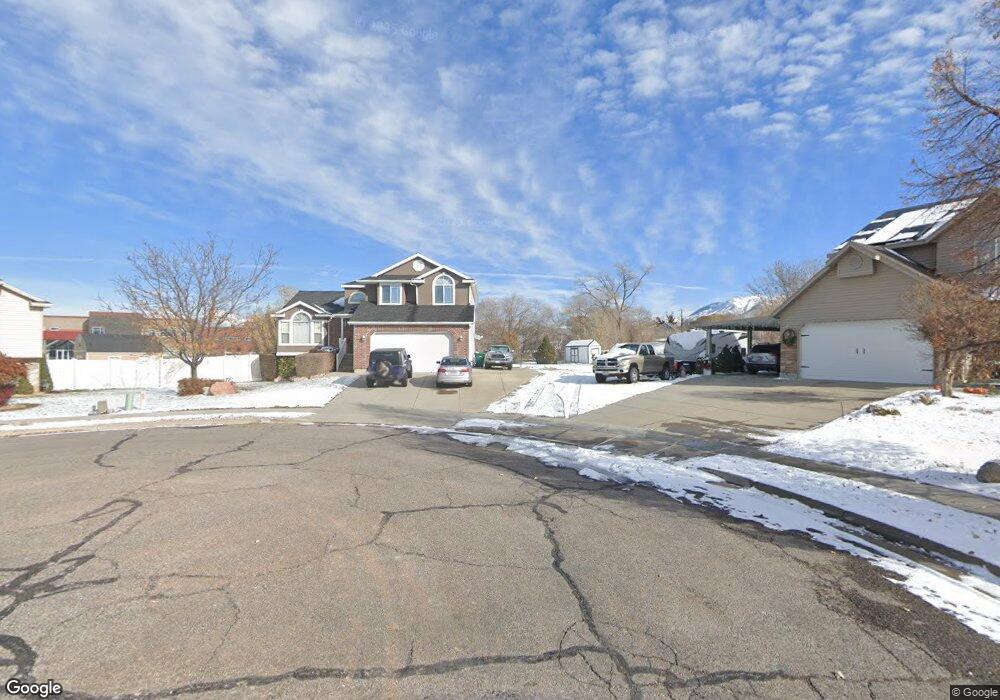
This home is located at 4830 S 3575 W, Roy, UT 84067 and is currently estimated at $548,534, approximately $230 per square foot. 4830 S 3575 W is a home located in Weber County with nearby schools including Freedom School, Roy Junior High School, and Roy High School.
Ownership History
Date
Name
Owned For
Owner Type
Purchase Details
Closed on
Apr 21, 2009
Sold by
Allred Brian J
Bought by
Allred Brian J and Allred Tina M
Current Estimated Value
Home Financials for this Owner
Home Financials are based on the most recent Mortgage that was taken out on this home.
Original Mortgage
$215,916
Outstanding Balance
$137,079
Interest Rate
5.02%
Mortgage Type
FHA
Estimated Equity
$411,455
Purchase Details
Closed on
Aug 15, 2005
Sold by
Steed Kailey and Steed Josh
Bought by
Crosby Brian and Crosby Katherine
Home Financials for this Owner
Home Financials are based on the most recent Mortgage that was taken out on this home.
Original Mortgage
$175,187
Interest Rate
5.56%
Mortgage Type
VA
Purchase Details
Closed on
Jul 11, 2003
Sold by
Farr Don R
Bought by
Steed Kailey and Steed Josh
Home Financials for this Owner
Home Financials are based on the most recent Mortgage that was taken out on this home.
Original Mortgage
$168,850
Interest Rate
5.22%
Mortgage Type
Purchase Money Mortgage
Create a Home Valuation Report for This Property
The Home Valuation Report is an in-depth analysis detailing your home's value as well as a comparison with similar homes in the area
Home Values in the Area
Average Home Value in this Area
Purchase History
| Date | Buyer | Sale Price | Title Company |
|---|---|---|---|
| Allred Brian J | -- | United Title Services | |
| Allred Brian J | -- | Bonneville Superior Title Co | |
| Crosby Brian | -- | First American Title | |
| Steed Kailey | -- | Founders Title |
Source: Public Records
Mortgage History
| Date | Status | Borrower | Loan Amount |
|---|---|---|---|
| Open | Allred Brian J | $215,916 | |
| Previous Owner | Crosby Brian | $175,187 | |
| Previous Owner | Steed Kailey | $168,850 |
Source: Public Records
Tax History
| Year | Tax Paid | Tax Assessment Tax Assessment Total Assessment is a certain percentage of the fair market value that is determined by local assessors to be the total taxable value of land and additions on the property. | Land | Improvement |
|---|---|---|---|---|
| 2025 | $3,451 | $554,485 | $142,606 | $411,879 |
| 2024 | $3,284 | $291,499 | $78,433 | $213,066 |
| 2023 | $3,044 | $269,500 | $77,326 | $192,174 |
| 2022 | $3,203 | $292,050 | $63,026 | $229,024 |
| 2021 | $2,772 | $417,000 | $88,362 | $328,638 |
| 2020 | $2,646 | $366,000 | $88,362 | $277,638 |
| 2019 | $2,435 | $316,000 | $44,161 | $271,839 |
| 2018 | $2,305 | $282,000 | $44,161 | $237,839 |
| 2017 | $2,295 | $265,000 | $49,625 | $215,375 |
| 2016 | $2,051 | $126,594 | $25,385 | $101,209 |
| 2015 | $1,875 | $118,363 | $25,385 | $92,978 |
| 2014 | $1,771 | $110,043 | $25,385 | $84,658 |
Source: Public Records
Map
Nearby Homes
- 3509 W 4835 S Unit 26
- 3517 W 4835 S Unit 27
- 3443 W 5200 S Unit 2&3
- 4813 S 3850 W
- 4950 3900 West St
- 3405 W 4525 S
- 5155 S 3200 W
- 4510 Stone Creek Rd Unit F
- 4491 Haven Creek Rd Unit A
- 3610 W 4475 S
- 4435 Cross Creek Rd Unit 29C
- 4793 S 3025 W
- 4602 S 4000 W
- 4024 W 4650 S
- 3022 W 4750 S
- 5321 S 3100 W
- 5141 S 2975 W
- 4096 W 5075 S
- 5009 S 2925 W
- 4088 W 5050 S
- 4834 S 3575 W
- 3533 W 4835 S Unit 30
- 4829 S 3575 W
- 4905 S 3500 W
- 4905 S 3500 W
- 3547 W 4835 S Unit 32
- 3524 W 4835 S
- 3534 W 4835 S Unit 20
- 3534 W 4835 S
- 3518 W 4835 S Unit 23
- 3542 W 4835 S Unit LOT 19
- 4933 S 3500 W Unit 4937
- 4838 S 3575 W
- 3512 W 4835 S
- 4833 S 3575 W
- 4833 S 3575 W
- 4833 S 3575 W Unit 14
- 4885 S 3500 W
- 4837 S 3575 W
- 4842 S 3575 W
Your Personal Tour Guide
Ask me questions while you tour the home.