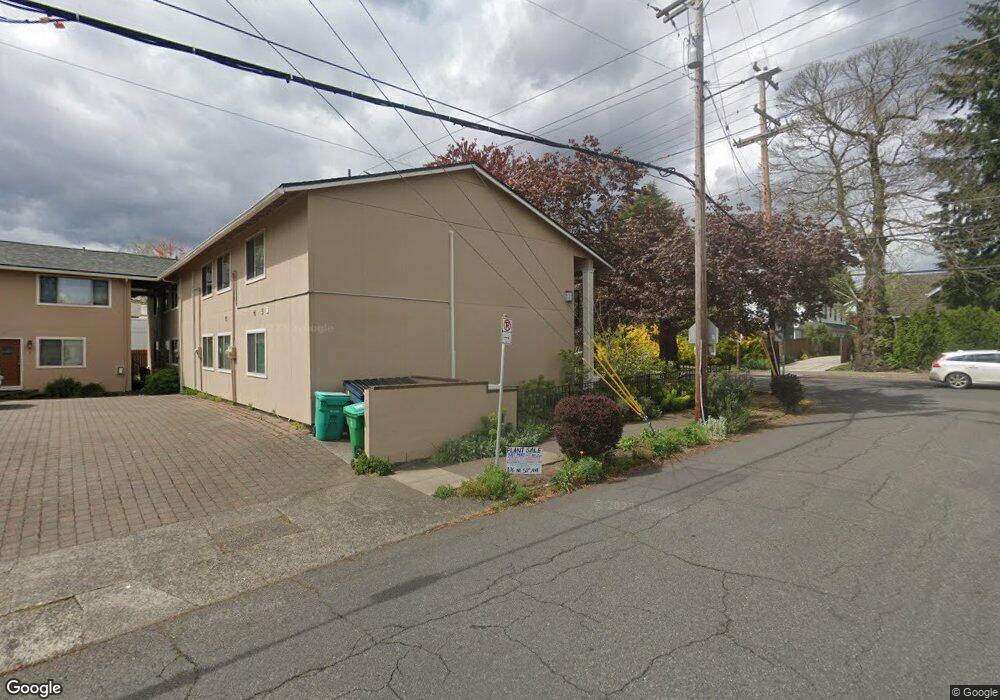
4830 SE Stark St Unit 7 Portland, OR 97215
Sunnyside NeighborhoodEstimated Value: $330,000 - $416,000
2
Beds
2
Baths
960
Sq Ft
$388/Sq Ft
Est. Value
About This Home
This home is located at 4830 SE Stark St Unit 7, Portland, OR 97215 and is currently estimated at $372,778, approximately $388 per square foot. 4830 SE Stark St Unit 7 is a home located in Multnomah County with nearby schools including Glencoe Elementary School, Mt Tabor Middle School, and Franklin High School.
Ownership History
Date
Name
Owned For
Owner Type
Purchase Details
Closed on
Feb 24, 2017
Sold by
Reese Rebecca A
Bought by
Yap Kevin Roger
Current Estimated Value
Home Financials for this Owner
Home Financials are based on the most recent Mortgage that was taken out on this home.
Original Mortgage
$175,000
Outstanding Balance
$144,796
Interest Rate
4.09%
Mortgage Type
New Conventional
Estimated Equity
$227,982
Purchase Details
Closed on
Mar 13, 2013
Sold by
Tucker Emily E
Bought by
Reese Rebecca A
Home Financials for this Owner
Home Financials are based on the most recent Mortgage that was taken out on this home.
Original Mortgage
$203,500
Interest Rate
3.53%
Mortgage Type
FHA
Purchase Details
Closed on
Aug 21, 2008
Sold by
West Tabor Condominiums Llc
Bought by
Tucker Emily E
Home Financials for this Owner
Home Financials are based on the most recent Mortgage that was taken out on this home.
Original Mortgage
$181,550
Interest Rate
5.59%
Mortgage Type
FHA
Create a Home Valuation Report for This Property
The Home Valuation Report is an in-depth analysis detailing your home's value as well as a comparison with similar homes in the area
Home Values in the Area
Average Home Value in this Area
Purchase History
| Date | Buyer | Sale Price | Title Company |
|---|---|---|---|
| Yap Kevin Roger | $297,500 | Wfg Title | |
| Reese Rebecca A | $211,000 | Lawyers Title | |
| Tucker Emily E | $184,900 | First American |
Source: Public Records
Mortgage History
| Date | Status | Borrower | Loan Amount |
|---|---|---|---|
| Open | Yap Kevin Roger | $175,000 | |
| Previous Owner | Reese Rebecca A | $203,500 | |
| Previous Owner | Tucker Emily E | $181,550 |
Source: Public Records
Tax History Compared to Growth
Tax History
| Year | Tax Paid | Tax Assessment Tax Assessment Total Assessment is a certain percentage of the fair market value that is determined by local assessors to be the total taxable value of land and additions on the property. | Land | Improvement |
|---|---|---|---|---|
| 2024 | $4,689 | $175,250 | -- | $175,250 |
| 2023 | $4,509 | $170,150 | $0 | $170,150 |
| 2022 | $4,411 | $165,200 | $0 | $0 |
| 2021 | $4,337 | $160,390 | $0 | $0 |
| 2020 | $3,978 | $155,720 | $0 | $0 |
| 2019 | $3,832 | $151,190 | $0 | $0 |
| 2018 | $3,719 | $146,790 | $0 | $0 |
| 2017 | $3,565 | $142,520 | $0 | $0 |
| 2016 | $3,262 | $138,370 | $0 | $0 |
| 2015 | $3,177 | $134,340 | $0 | $0 |
| 2014 | $3,129 | $130,430 | $0 | $0 |
Source: Public Records
Map
Nearby Homes
- 626 SE 49th Ave
- 4738 SE Belmont St
- 436 SE 44th Ave
- 366 SE 44th Ave
- 4323 SE Alder St
- 823 SE 45th Ave
- 4435 SE Belmont St
- 4272 SE Washington St
- 36 SE 52nd Ave Unit 2
- 4434 E Burnside St
- 910 SE 42nd Ave Unit 250
- 5618 SE Pine St
- 11 NE 55th Ave
- 5617 SE Belmont St Unit 5625
- 1203 SE 53rd Ave
- 1324 SE 50th Ave
- 5325-5327 NE Davis St
- 922 934 SE 40th Ave
- 631 SE Peacock Ln
- 4356 NE Davis St
- 4830 SE Stark St
- 4830 SE Stark St Unit 10
- 4830 SE Stark St Unit 9
- 4830 SE Stark St Unit 8
- 4830 SE Stark St Unit 6
- 4830 SE Stark St Unit 5
- 4830 SE Stark St Unit 4
- 4830 SE Stark St Unit 3
- 4830 SE Stark St Unit 2
- 4830 SE Stark St Unit 1
- 4830 SE Stark St
- 4830 SE Stark (On 49th) St Unit 10
- 4929 SE Stark St
- 529 SE 49th Ave
- 526 SE 48th Ave
- 434 SE 49th Ave
- 536 SE 48th Ave
- 4915 SE Stark St
- 526 SE 49th Ave
- 547 SE 49th Ave