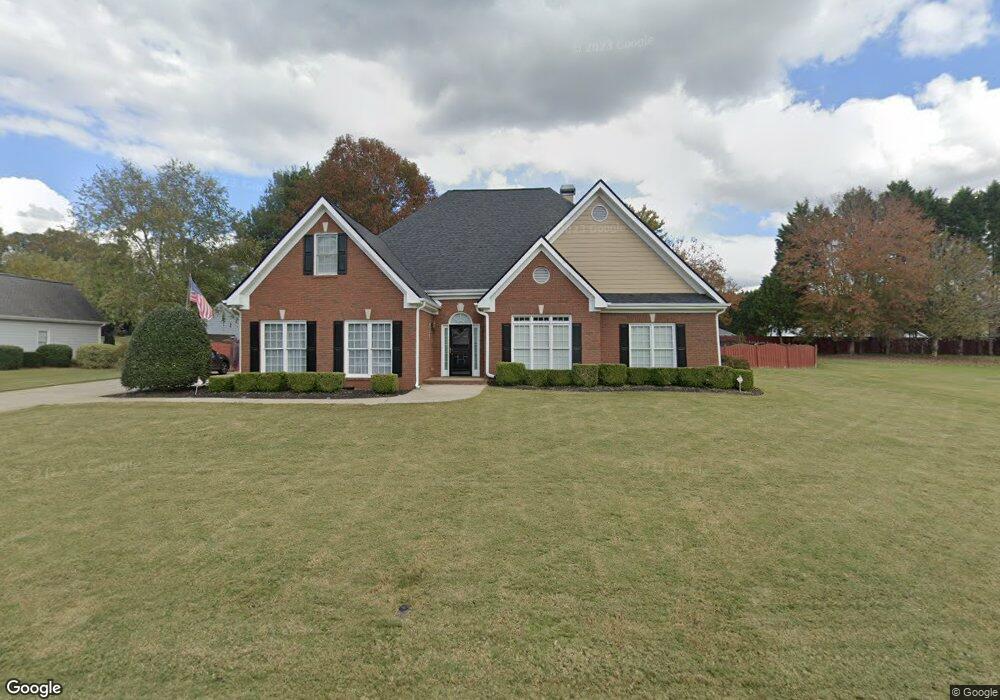
4830 Streamside Dr Flowery Branch, GA 30542
Estimated Value: $402,995 - $514,000
4
Beds
2
Baths
2,289
Sq Ft
$201/Sq Ft
Est. Value
About This Home
This home is located at 4830 Streamside Dr, Flowery Branch, GA 30542 and is currently estimated at $459,499, approximately $200 per square foot. 4830 Streamside Dr is a home located in Hall County with nearby schools including Chestnut Mountain Elementary School, South Hall Middle School, and Johnson High School.
Ownership History
Date
Name
Owned For
Owner Type
Purchase Details
Closed on
Apr 26, 2011
Sold by
Cartus Corp
Bought by
Kennedy Michael L and Kennedy Marilyn S
Current Estimated Value
Purchase Details
Closed on
Jun 8, 2005
Sold by
Klug Bruce A and Klug Jennifer
Bought by
Allen Christine D
Home Financials for this Owner
Home Financials are based on the most recent Mortgage that was taken out on this home.
Original Mortgage
$194,400
Interest Rate
5.66%
Mortgage Type
New Conventional
Purchase Details
Closed on
Jun 15, 2000
Sold by
Josh Porter Builders Inc
Bought by
Klug Jennifer L and Klug Bruce A
Home Financials for this Owner
Home Financials are based on the most recent Mortgage that was taken out on this home.
Original Mortgage
$167,300
Interest Rate
7.5%
Mortgage Type
New Conventional
Purchase Details
Closed on
Dec 9, 1999
Sold by
Clark H Wayne Llc
Bought by
Porter Josh Builders Inc
Create a Home Valuation Report for This Property
The Home Valuation Report is an in-depth analysis detailing your home's value as well as a comparison with similar homes in the area
Home Values in the Area
Average Home Value in this Area
Purchase History
| Date | Buyer | Sale Price | Title Company |
|---|---|---|---|
| Kennedy Michael L | $160,400 | -- | |
| Cartus Corp | $182,500 | -- | |
| Allen Christine D | $216,000 | -- | |
| Klug Jennifer L | $189,300 | -- | |
| Porter Josh Builders Inc | $162,500 | -- |
Source: Public Records
Mortgage History
| Date | Status | Borrower | Loan Amount |
|---|---|---|---|
| Previous Owner | Allen Christine D | $194,400 | |
| Previous Owner | Klug Jennifer L | $167,300 |
Source: Public Records
Tax History Compared to Growth
Tax History
| Year | Tax Paid | Tax Assessment Tax Assessment Total Assessment is a certain percentage of the fair market value that is determined by local assessors to be the total taxable value of land and additions on the property. | Land | Improvement |
|---|---|---|---|---|
| 2025 | $1,203 | $161,880 | $26,040 | $135,840 |
| 2024 | $1,299 | $145,200 | $24,320 | $120,880 |
| 2023 | $1,119 | $136,520 | $23,560 | $112,960 |
| 2022 | $1,147 | $116,600 | $21,000 | $95,600 |
| 2021 | $1,118 | $107,200 | $20,000 | $87,200 |
| 2020 | $1,000 | $92,120 | $10,680 | $81,440 |
| 2019 | $976 | $87,440 | $10,680 | $76,760 |
| 2018 | $1,024 | $89,960 | $10,680 | $79,280 |
| 2017 | $903 | $82,880 | $10,680 | $72,200 |
| 2016 | $762 | $75,641 | $9,160 | $66,481 |
| 2015 | $2,158 | $75,641 | $9,160 | $66,481 |
| 2014 | $2,158 | $75,641 | $9,160 | $66,481 |
Source: Public Records
Map
Nearby Homes
- 4998 Planters Way
- 4577 Winder Hwy
- 4559 Winder Hwy
- 5214 Nimble Wood Way
- 5165 Strickland Rd
- 5306 Weeping Creek Trail
- 5392 Retreat Dr
- 4211 Quail Creek Dr
- 5356 Retreat Dr
- 5313 Founders Way Unit 36
- 5313 Founders Way
- 5314 Founders Way
- 5314 Founders Way Unit 35
- 5309 Founders Way
- 4226 Quail Creek Dr
- 5377 Retreat Dr
- 5329 Retreat Dr
- 4835 Upper Berkshire Rd
- 4836 Streamside Dr
- 4826 Streamside Dr
- 4941 Planters Way
- 4931 Planters Way
- 4827 Streamside Dr
- 4835 Streamside Dr Unit 15
- 4835 Streamside Dr
- 4822 Streamside Dr
- 4927 Planters Way Unit 61
- 4927 Planters Way
- 4927 Planters Way Unit B
- 4927 Planters Way Unit A
- 4823 Streamside Dr
- 4823 Streamside Dr Unit 13
- 4951 Harvest Ct
- 4970 Planters Way
- 4956 Harvest Ct
- 4966 Planters Way
- 4948 Planters Way
- 4952 Planters Way