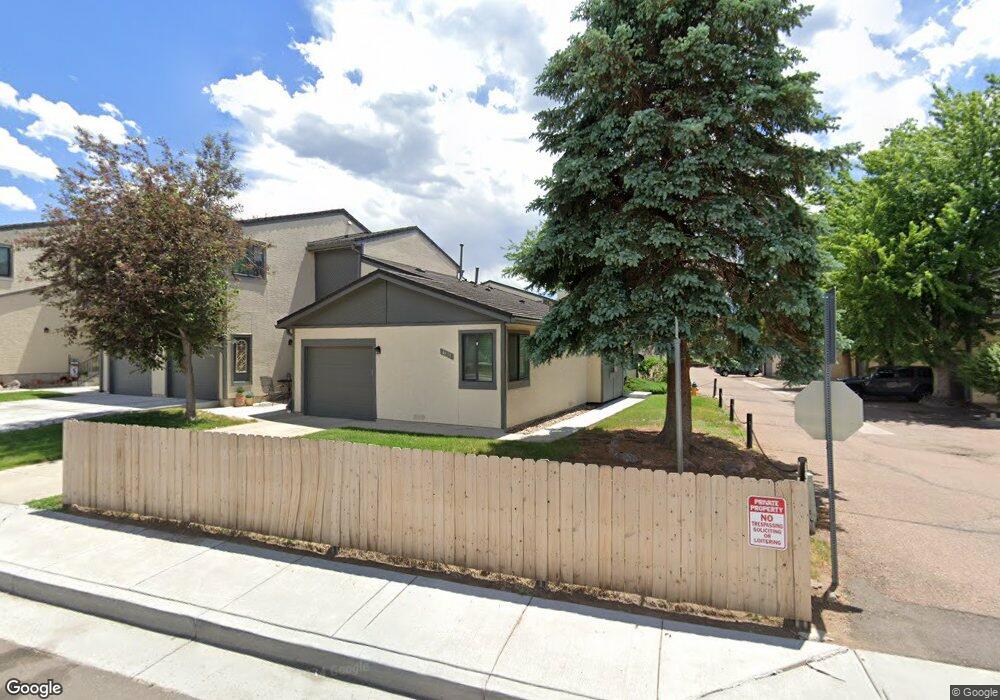
4831 Bluestem Dr Colorado Springs, CO 80917
Old Farms NeighborhoodEstimated Value: $256,916 - $278,000
2
Beds
1
Bath
945
Sq Ft
$281/Sq Ft
Est. Value
About This Home
This home is located at 4831 Bluestem Dr, Colorado Springs, CO 80917 and is currently estimated at $265,729, approximately $281 per square foot. 4831 Bluestem Dr is a home located in El Paso County with nearby schools including Rudy Elementary School, Sabin Middle School, and Doherty High School.
Ownership History
Date
Name
Owned For
Owner Type
Purchase Details
Closed on
Apr 30, 2010
Sold by
Walker Rosemary R
Bought by
Singleton Kathleen A
Current Estimated Value
Home Financials for this Owner
Home Financials are based on the most recent Mortgage that was taken out on this home.
Original Mortgage
$83,842
Outstanding Balance
$56,744
Interest Rate
5.25%
Mortgage Type
FHA
Estimated Equity
$208,985
Purchase Details
Closed on
Jul 27, 1993
Bought by
Singleton Kathleen A
Purchase Details
Closed on
Jul 23, 1990
Bought by
Singleton Kathleen A
Purchase Details
Closed on
Nov 22, 1989
Bought by
Singleton Kathleen A
Purchase Details
Closed on
Apr 1, 1989
Bought by
Singleton Kathleen A
Purchase Details
Closed on
Oct 1, 1985
Bought by
Singleton Kathleen A
Purchase Details
Closed on
Aug 1, 1981
Bought by
Singleton Kathleen A
Create a Home Valuation Report for This Property
The Home Valuation Report is an in-depth analysis detailing your home's value as well as a comparison with similar homes in the area
Home Values in the Area
Average Home Value in this Area
Purchase History
| Date | Buyer | Sale Price | Title Company |
|---|---|---|---|
| Singleton Kathleen A | $103,000 | Fidelity National Title Insu | |
| Singleton Kathleen A | $57,300 | -- | |
| Singleton Kathleen A | $37,500 | -- | |
| Singleton Kathleen A | $38,500 | -- | |
| Singleton Kathleen A | -- | -- | |
| Singleton Kathleen A | -- | -- | |
| Singleton Kathleen A | -- | -- |
Source: Public Records
Mortgage History
| Date | Status | Borrower | Loan Amount |
|---|---|---|---|
| Open | Singleton Kathleen A | $83,842 |
Source: Public Records
Tax History Compared to Growth
Tax History
| Year | Tax Paid | Tax Assessment Tax Assessment Total Assessment is a certain percentage of the fair market value that is determined by local assessors to be the total taxable value of land and additions on the property. | Land | Improvement |
|---|---|---|---|---|
| 2025 | $805 | $19,560 | -- | -- |
| 2024 | $698 | $18,860 | $4,070 | $14,790 |
| 2023 | $698 | $18,860 | $4,070 | $14,790 |
| 2022 | $748 | $13,360 | $2,780 | $10,580 |
| 2021 | $811 | $13,750 | $2,860 | $10,890 |
| 2020 | $764 | $11,260 | $1,790 | $9,470 |
| 2019 | $760 | $11,260 | $1,790 | $9,470 |
| 2018 | $617 | $8,410 | $1,300 | $7,110 |
| 2017 | $584 | $8,410 | $1,300 | $7,110 |
| 2016 | $508 | $8,760 | $1,270 | $7,490 |
| 2015 | $506 | $8,760 | $1,270 | $7,490 |
| 2014 | $510 | $8,470 | $1,270 | $7,200 |
Source: Public Records
Map
Nearby Homes
- 4652 Excalibur Ct
- 4636 Winewood Village Dr
- 4955 Chickweed Dr
- 4534 Winewood Village Dr Unit P4534
- 4774 Bunchberry Ln
- 5002 Barnes Rd
- 4671 Winewood Village Dr Unit X4671
- 4501 Winewood Village Dr Unit K4501
- 4685 Barnes Rd
- 4768 S Gracemoor Cir
- 4735 Iron Horse Villas Point
- 4317 Sammers View
- 5117 Solar Ridge Dr
- 4878 S Old Brook Cir
- 5102 Rainbow Harbour Cir
- 4504 Bell Flower Dr
- 4842 S Old Brook Cir
- 5210 Coneflower Ln
- 5183 Solar Ridge Dr
- 4835 W Old Farm Cir
- 4833 Bluestem Dr
- 4835 Bluestem Dr
- 4837 Bluestem Dr
- 4845 Bluestem Dr
- 4839 Bluestem Dr
- 4809 Bluestem Dr
- 4847 Bluestem Dr
- 4805 Bluestem Dr
- 4811 Bluestem Dr
- 4841 Bluestem Dr
- 4849 Bluestem Dr
- 4813 Bluestem Dr
- 4815 Bluestem Dr
- 4843 Bluestem Dr
- 4885 Bluestem Dr
- 4851 Bluestem Dr
- 4883 Bluestem Dr
- 4853 Bluestem Dr
- 4820 Bluestem Dr
- 4817 Bluestem Dr