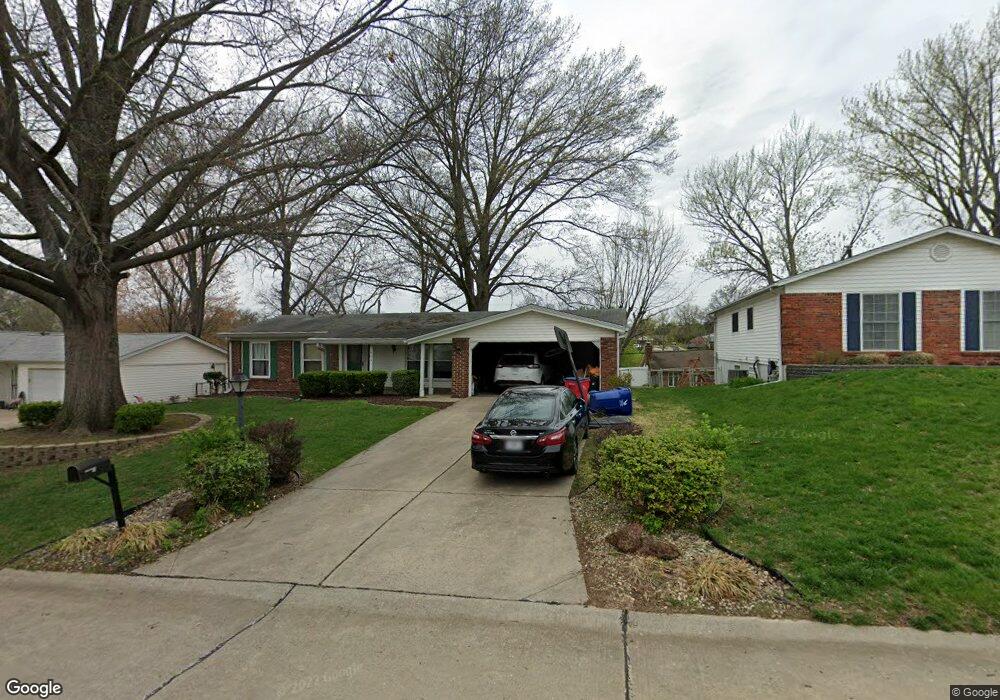
4831 Danebury Dr Saint Louis, MO 63128
Estimated Value: $324,000 - $375,000
4
Beds
2
Baths
1,442
Sq Ft
$234/Sq Ft
Est. Value
About This Home
This home is located at 4831 Danebury Dr, Saint Louis, MO 63128 and is currently estimated at $337,644, approximately $234 per square foot. 4831 Danebury Dr is a home located in St. Louis County with nearby schools including Kennerly Elementary School, Sperreng Middle School, and Lindbergh High School.
Ownership History
Date
Name
Owned For
Owner Type
Purchase Details
Closed on
Jan 10, 2022
Sold by
Demetrius Easley
Bought by
Easley Riisa Renee
Current Estimated Value
Home Financials for this Owner
Home Financials are based on the most recent Mortgage that was taken out on this home.
Original Mortgage
$160,000
Outstanding Balance
$126,092
Interest Rate
2.43%
Estimated Equity
$211,552
Purchase Details
Closed on
May 1, 2008
Sold by
Betty L & John W Wagner Revocable Trust
Bought by
Rawlins Riisa R
Home Financials for this Owner
Home Financials are based on the most recent Mortgage that was taken out on this home.
Original Mortgage
$178,489
Interest Rate
5.86%
Mortgage Type
FHA
Purchase Details
Closed on
Aug 7, 2006
Sold by
Rahman Shaila
Bought by
Revocable Living Trust Of Shaila Rahman
Purchase Details
Closed on
May 27, 2004
Sold by
Wagner John W and Wagner Betty L
Bought by
Wagner Betty L and Wagner John W
Create a Home Valuation Report for This Property
The Home Valuation Report is an in-depth analysis detailing your home's value as well as a comparison with similar homes in the area
Home Values in the Area
Average Home Value in this Area
Purchase History
| Date | Buyer | Sale Price | Title Company |
|---|---|---|---|
| Easley Riisa Renee | -- | Freedom Title | |
| Rawlins Riisa R | $179,900 | None Available | |
| Revocable Living Trust Of Shaila Rahman | -- | None Available | |
| Wagner Betty L | -- | -- |
Source: Public Records
Mortgage History
| Date | Status | Borrower | Loan Amount |
|---|---|---|---|
| Open | Easley Riisa Renee | $160,000 | |
| Previous Owner | Rawlins Riisa R | $178,489 |
Source: Public Records
Tax History Compared to Growth
Tax History
| Year | Tax Paid | Tax Assessment Tax Assessment Total Assessment is a certain percentage of the fair market value that is determined by local assessors to be the total taxable value of land and additions on the property. | Land | Improvement |
|---|---|---|---|---|
| 2025 | $3,477 | $52,690 | $14,160 | $38,530 |
| 2024 | $3,477 | $53,400 | $14,160 | $39,240 |
| 2023 | $3,469 | $53,400 | $14,160 | $39,240 |
| 2022 | $2,936 | $43,310 | $14,160 | $29,150 |
| 2021 | $2,832 | $43,310 | $14,160 | $29,150 |
| 2020 | $2,459 | $36,240 | $14,160 | $22,080 |
| 2019 | $2,453 | $36,240 | $14,160 | $22,080 |
| 2018 | $2,483 | $33,370 | $8,650 | $24,720 |
| 2017 | $2,456 | $33,370 | $8,650 | $24,720 |
| 2016 | $2,228 | $28,710 | $7,890 | $20,820 |
| 2015 | $2,194 | $28,710 | $7,890 | $20,820 |
| 2014 | $2,591 | $33,650 | $6,950 | $26,700 |
Source: Public Records
Map
Nearby Homes
- 4801 Langtree Dr
- 5135 Towne Centre Dr
- 5100 Melitta Dr
- 4839 Hursley Dr
- 4833 Hursley Dr
- 4645 Tauneybrook Dr
- 4942 Caribee Dr
- 4643 Littlebury Dr
- 5057 Peyton Place Ct
- 4818 Chapel Hill Dr
- 4915 Butler Hill Rd
- 4947 Butler Hill Rd
- 10016 Schuessler Rd
- 4449 Pinyon Jay Ct
- 5263 Faro Dr
- 5161 Butler Bend Dr
- 4829 Vermilion Dr
- 12055 Charwick Dr
- 10033 Carolynne Dr
- 10124 Carolynne Dr
- 4839 Danebury Dr
- 4825 Danebury Dr
- 4849 Broad Oak Dr
- 4843 Broad Oak Dr
- 4855 Broad Oak Dr
- 4847 Danebury Dr
- 4819 Danebury Dr
- 4836 Danebury Dr
- 4828 Danebury Dr
- 4844 Danebury Dr
- 4861 Broad Oak Dr
- 4822 Danebury Dr
- 4837 Broad Oak Dr
- 4811 Danebury Dr
- 4852 Danebury Dr
- 4855 Danebury Dr
- 4829 Holmeswood Ct
- 4814 Danebury Dr
- 4828 Broad Oak Dr
- 4817 Holmeswood Ct