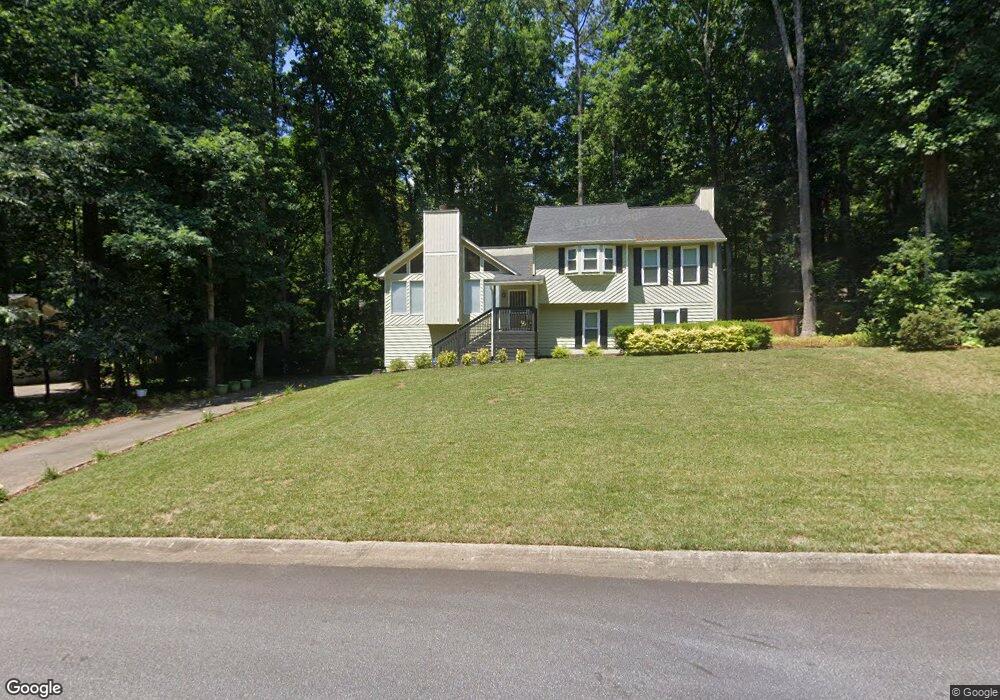
4831 Summer Ln NW Acworth, GA 30102
Estimated Value: $338,000 - $355,000
3
Beds
3
Baths
1,540
Sq Ft
$224/Sq Ft
Est. Value
About This Home
This home is located at 4831 Summer Ln NW, Acworth, GA 30102 and is currently estimated at $344,602, approximately $223 per square foot. 4831 Summer Ln NW is a home located in Cobb County with nearby schools including Pitner Elementary School, Palmer Middle School, and Kell High School.
Ownership History
Date
Name
Owned For
Owner Type
Purchase Details
Closed on
Sep 12, 2016
Sold by
Deborah L
Bought by
Anderson D L
Current Estimated Value
Purchase Details
Closed on
Jul 21, 2016
Sold by
Deborah L
Bought by
D L Anderson Revoc Trust
Purchase Details
Closed on
Aug 18, 2006
Sold by
Voss Roderick E
Bought by
Anderson Alfred and Anderson Deborah L
Home Financials for this Owner
Home Financials are based on the most recent Mortgage that was taken out on this home.
Original Mortgage
$117,800
Interest Rate
6.67%
Mortgage Type
New Conventional
Purchase Details
Closed on
Jun 16, 2000
Sold by
Dalusky Jeff A and Dalusky Denise L
Bought by
Voss Roderick E
Home Financials for this Owner
Home Financials are based on the most recent Mortgage that was taken out on this home.
Original Mortgage
$115,920
Interest Rate
8.54%
Mortgage Type
New Conventional
Create a Home Valuation Report for This Property
The Home Valuation Report is an in-depth analysis detailing your home's value as well as a comparison with similar homes in the area
Home Values in the Area
Average Home Value in this Area
Purchase History
| Date | Buyer | Sale Price | Title Company |
|---|---|---|---|
| Anderson D L | -- | -- | |
| D L Anderson Revoc Trust | -- | -- | |
| Anderson Alfred | $162,800 | -- | |
| Voss Roderick E | $144,900 | -- |
Source: Public Records
Mortgage History
| Date | Status | Borrower | Loan Amount |
|---|---|---|---|
| Previous Owner | Anderson Alfred | $117,800 | |
| Previous Owner | Voss Roderick E | $115,920 |
Source: Public Records
Tax History Compared to Growth
Tax History
| Year | Tax Paid | Tax Assessment Tax Assessment Total Assessment is a certain percentage of the fair market value that is determined by local assessors to be the total taxable value of land and additions on the property. | Land | Improvement |
|---|---|---|---|---|
| 2025 | $839 | $132,820 | $32,000 | $100,820 |
| 2024 | $859 | $138,696 | $26,000 | $112,696 |
| 2023 | $602 | $121,472 | $16,000 | $105,472 |
| 2022 | $747 | $101,324 | $16,000 | $85,324 |
| 2021 | $1,993 | $79,372 | $16,000 | $63,372 |
| 2020 | $1,993 | $79,372 | $16,000 | $63,372 |
| 2019 | $1,948 | $77,324 | $16,000 | $61,324 |
| 2018 | $1,694 | $65,708 | $16,000 | $49,708 |
| 2017 | $1,393 | $57,384 | $12,000 | $45,384 |
| 2016 | $1,394 | $57,384 | $12,000 | $45,384 |
| 2015 | $1,268 | $51,884 | $12,000 | $39,884 |
| 2014 | $1,279 | $51,884 | $0 | $0 |
Source: Public Records
Map
Nearby Homes
- 1172 Ridgeside Dr NW
- 4949 Woodland Way NW
- 1033 Justice Ln NW
- 1071 Ferry Creek Way
- 1220 Wade Green Cir NW Unit 1
- 1361 Summit Ln NW
- 4815 Wade Green Rd NW Unit 1
- 4815 Wade Green Rd NW
- 5464 Wade Green Rd
- 4955 Day Lily Way NW
- 367 Lake Forest Dr
- 5119 Verbena Dr NW
- 4809 Burlington Ct NW
- 805 Silver Mound Cir NW
- 5114 Verbena Dr NW
- 611 Ashley Forest Dr NW
- 1140 Reading Dr NW
- 243 Odell St
- 5357 Wade Green Rd
- 1169 Ridgeside Dr NW Unit 2
- 4833 Summer Ln NW Unit 1
- 4829 Summer Ln NW
- 1167 Ridgeside Dr NW
- 1171 Ridgeside Dr NW
- 4828 Summer Ln NW
- 4826 Summer Ln NW
- 1028 Summer Place NW
- 5175 Willow Tarn
- 5183 Willow Tarn
- 1173 Ridgeside Dr NW
- 1168 Ridgeside Dr NW Unit 2
- 4830 Summer Ln NW
- 5167 Willow Tarn
- 5191 Willow Tarn
- 1030 Summer Place NW
- 1024 Summer Place NW
- 1175 Ridgeside Dr NW
- 5159 Willow Tarn
- 1027 Summer Place NW