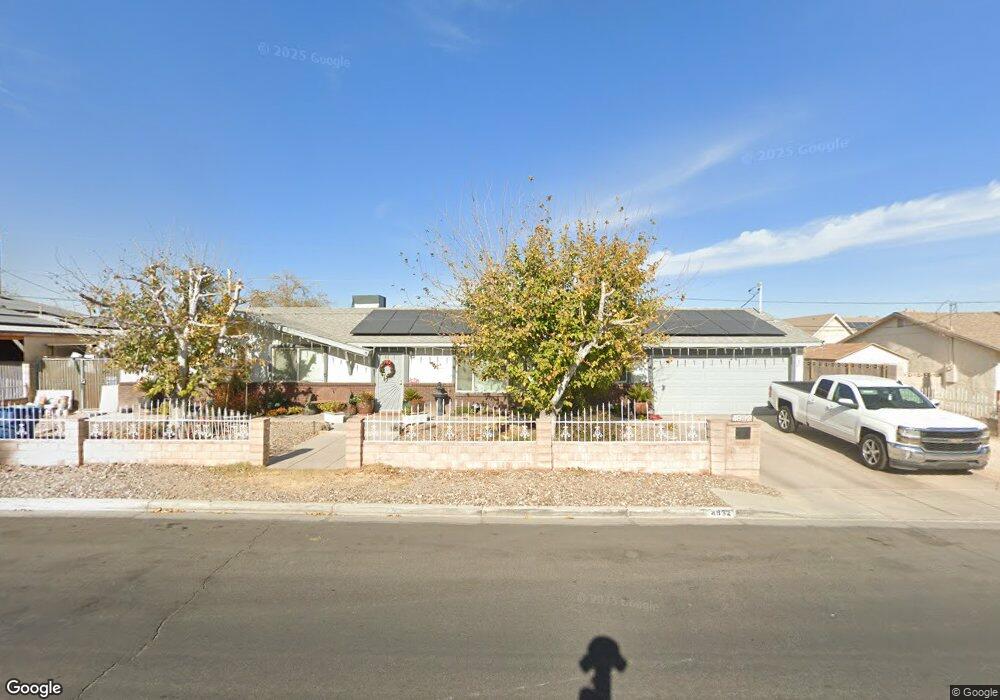
4832 E Baltimore Ave Las Vegas, NV 89104
Estimated Value: $360,031 - $416,000
3
Beds
2
Baths
1,506
Sq Ft
$259/Sq Ft
Est. Value
About This Home
This home is located at 4832 E Baltimore Ave, Las Vegas, NV 89104 and is currently estimated at $389,508, approximately $258 per square foot. 4832 E Baltimore Ave is a home located in Clark County with nearby schools including Cyril Wengert Elementary School, Jerome Mack Middle School, and Chaparral High School.
Ownership History
Date
Name
Owned For
Owner Type
Purchase Details
Closed on
Nov 7, 2007
Sold by
Lopez Jose Alberto and Lopez Martina Cruz
Bought by
Lopez Martina Cruz and Lopez Jose Alberto
Current Estimated Value
Home Financials for this Owner
Home Financials are based on the most recent Mortgage that was taken out on this home.
Original Mortgage
$200,000
Outstanding Balance
$126,346
Interest Rate
6.35%
Mortgage Type
New Conventional
Estimated Equity
$263,162
Purchase Details
Closed on
Aug 22, 2000
Sold by
Sweat Thomas C
Bought by
Lopez Jose Albert and Cruz Martina
Home Financials for this Owner
Home Financials are based on the most recent Mortgage that was taken out on this home.
Original Mortgage
$123,978
Interest Rate
8.15%
Purchase Details
Closed on
Sep 14, 1994
Sold by
Loveland Victoria and Loveland Odell Cyrus
Bought by
Simons Quay M and Simons Carol
Create a Home Valuation Report for This Property
The Home Valuation Report is an in-depth analysis detailing your home's value as well as a comparison with similar homes in the area
Home Values in the Area
Average Home Value in this Area
Purchase History
| Date | Buyer | Sale Price | Title Company |
|---|---|---|---|
| Lopez Martina Cruz | -- | National Alliance Title | |
| Lopez Jose Albert | $125,000 | Old Republic Title Company | |
| Simons Quay M | $87,000 | -- |
Source: Public Records
Mortgage History
| Date | Status | Borrower | Loan Amount |
|---|---|---|---|
| Open | Lopez Martina Cruz | $200,000 | |
| Closed | Lopez Jose Albert | $123,978 |
Source: Public Records
Tax History Compared to Growth
Tax History
| Year | Tax Paid | Tax Assessment Tax Assessment Total Assessment is a certain percentage of the fair market value that is determined by local assessors to be the total taxable value of land and additions on the property. | Land | Improvement |
|---|---|---|---|---|
| 2025 | $852 | $54,833 | $28,875 | $25,958 |
| 2024 | $824 | $54,833 | $28,875 | $25,958 |
| 2023 | $664 | $58,335 | $32,725 | $25,610 |
| 2022 | $800 | $50,971 | $26,950 | $24,021 |
| 2021 | $777 | $46,486 | $23,100 | $23,386 |
| 2020 | $751 | $46,430 | $22,715 | $23,715 |
| 2019 | $742 | $44,993 | $21,175 | $23,818 |
| 2018 | $708 | $39,147 | $15,925 | $23,222 |
| 2017 | $1,165 | $39,732 | $15,925 | $23,807 |
| 2016 | $664 | $34,858 | $10,395 | $24,463 |
| 2015 | $661 | $27,482 | $8,470 | $19,012 |
| 2014 | $641 | $22,016 | $7,700 | $14,316 |
Source: Public Records
Map
Nearby Homes
- 0 E Sahara Ave Unit 2582056
- 4765 E Cincinnati Ave
- 4928 E Philadelphia Ave
- 4619 E Cincinnati Ave
- 4906 E Chicago Ave
- 5083 Village Dr
- 4590 E Saint Louis Ave
- 4732 Krissylouise Way
- 4510 E Cleveland Ave
- 4708 Krissylouise Way
- 4555 E Sahara Ave Unit 276
- 4555 E Sahara Ave Unit 280
- 4555 E Sahara Ave Unit 288
- 4555 E Sahara Ave Unit 252
- 4555 E Sahara Ave Unit 226
- 4555 E Sahara Ave Unit 231
- 2685 Bryandouglas Dr
- 4682 Leeann Ln
- 1761 Arden St
- 5115 Blossom Ave
- 4820 E Baltimore Ave
- 4848 E Baltimore Ave
- 4843 Patterson Ave
- 4825 Patterson Ave
- 4845 E Baltimore Ave
- 4825 E Baltimore Ave
- 4810 E Baltimore Ave
- 4859 Patterson Ave
- 4811 Patterson Ave
- 4870 E Baltimore Ave
- 4811 E Baltimore Ave
- 4865 E Baltimore Ave
- 4830 Patterson Ave
- 4830 E Cleveland Ave
- 4820 E Cleveland Ave
- 4840 Patterson Ave
- 4880 E Baltimore Ave
- 4850 E Cleveland Ave
- 4877 Patterson Ave
- 4860 Patterson Ave