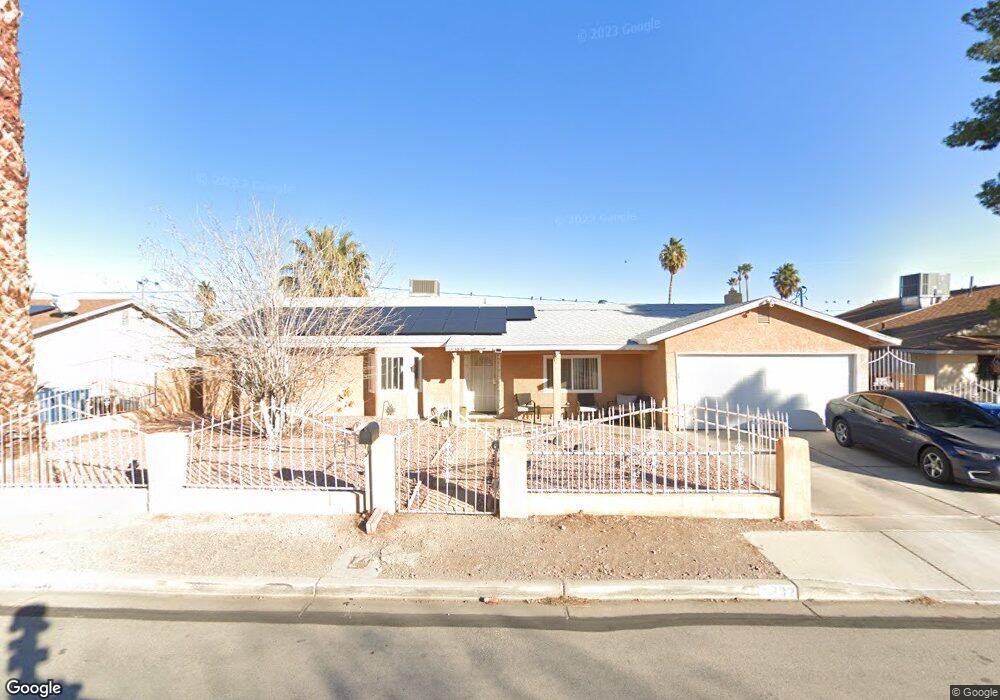
4832 E New York Ave Las Vegas, NV 89104
Estimated Value: $389,000 - $446,000
3
Beds
2
Baths
1,796
Sq Ft
$231/Sq Ft
Est. Value
About This Home
This home is located at 4832 E New York Ave, Las Vegas, NV 89104 and is currently estimated at $414,803, approximately $230 per square foot. 4832 E New York Ave is a home located in Clark County with nearby schools including Cyril Wengert Elementary School, Jerome Mack Middle School, and Chaparral High School.
Ownership History
Date
Name
Owned For
Owner Type
Purchase Details
Closed on
Jul 8, 1994
Sold by
Pagao Cirilo Lopez and Pagao Victoria
Bought by
Phillips Aretha A
Current Estimated Value
Home Financials for this Owner
Home Financials are based on the most recent Mortgage that was taken out on this home.
Original Mortgage
$106,700
Interest Rate
8.37%
Mortgage Type
FHA
Purchase Details
Closed on
Nov 2, 1993
Sold by
Pagao Victoria
Bought by
Pagao Cirilo Lopez and Pagao Victoria
Home Financials for this Owner
Home Financials are based on the most recent Mortgage that was taken out on this home.
Original Mortgage
$82,400
Interest Rate
7.21%
Purchase Details
Closed on
Sep 24, 1993
Sold by
Pagao Cirilo Lopez and Pagao Victoria
Bought by
Pagao Victoria
Home Financials for this Owner
Home Financials are based on the most recent Mortgage that was taken out on this home.
Original Mortgage
$82,400
Interest Rate
7.21%
Create a Home Valuation Report for This Property
The Home Valuation Report is an in-depth analysis detailing your home's value as well as a comparison with similar homes in the area
Home Values in the Area
Average Home Value in this Area
Purchase History
| Date | Buyer | Sale Price | Title Company |
|---|---|---|---|
| Phillips Aretha A | $108,000 | Old Republic Title Company | |
| Pagao Cirilo Lopez | -- | -- | |
| Pagao Victoria | -- | Nevada Title |
Source: Public Records
Mortgage History
| Date | Status | Borrower | Loan Amount |
|---|---|---|---|
| Previous Owner | Phillips Aretha A | $106,700 | |
| Previous Owner | Pagao Victoria | $82,400 |
Source: Public Records
Tax History Compared to Growth
Tax History
| Year | Tax Paid | Tax Assessment Tax Assessment Total Assessment is a certain percentage of the fair market value that is determined by local assessors to be the total taxable value of land and additions on the property. | Land | Improvement |
|---|---|---|---|---|
| 2025 | $1,159 | $73,565 | $26,250 | $47,315 |
| 2024 | $1,126 | $73,565 | $26,250 | $47,315 |
| 2023 | $1,126 | $75,322 | $29,750 | $45,572 |
| 2022 | $1,198 | $66,505 | $24,500 | $42,005 |
| 2021 | $1,110 | $61,354 | $21,000 | $40,354 |
| 2020 | $1,028 | $60,930 | $20,650 | $40,280 |
| 2019 | $963 | $59,266 | $19,250 | $40,016 |
| 2018 | $919 | $50,929 | $12,250 | $38,679 |
| 2017 | $1,516 | $51,695 | $12,250 | $39,445 |
| 2016 | $861 | $49,027 | $9,450 | $39,577 |
| 2015 | $859 | $38,310 | $7,700 | $30,610 |
| 2014 | $834 | $29,615 | $7,000 | $22,615 |
Source: Public Records
Map
Nearby Homes
- 4906 E Chicago Ave
- 4928 E Philadelphia Ave
- 5083 Village Dr
- 1405 S Nellis Blvd Unit 1121
- 1405 S Nellis Blvd Unit 1008
- 1405 S Nellis Blvd Unit 2082
- 1405 S Nellis Blvd Unit 2117
- 1405 S Nellis Blvd Unit 2087
- 5115 Blossom Ave
- 4939 Yuma Ave
- 4590 E Saint Louis Ave
- 4746 Yuma Ave
- 1761 Arden St
- 5171 Wyoming Ave
- 1836 Winterwood Blvd
- 1300 S Arlington St Unit 113
- 1300 S Arlington St Unit 126
- 1300 S Arlington St Unit 120
- 4765 E Cincinnati Ave
- 0 E Sahara Ave Unit 2582056
- 4820 E New York Ave
- 4840 E New York Ave
- 4825 E Wyoming Ave
- 4845 E Wyoming Ave
- 4815 E Wyoming Ave
- 4808 E New York Ave
- 4854 E New York Ave
- 4847 E New York Ave
- 4825 E New York Ave
- 4807 E Wyoming Ave
- 4855 E Wyoming Ave
- 4851 E New York Ave
- 4815 E New York Ave
- 4868 E New York Ave
- 4869 E Wyoming Ave
- 4840 E Chicago Ave
- 4830 E Chicago Ave
- 4830 E Wyoming Ave
- 4851 E Chicago Ave
- 4822 E Wyoming Ave