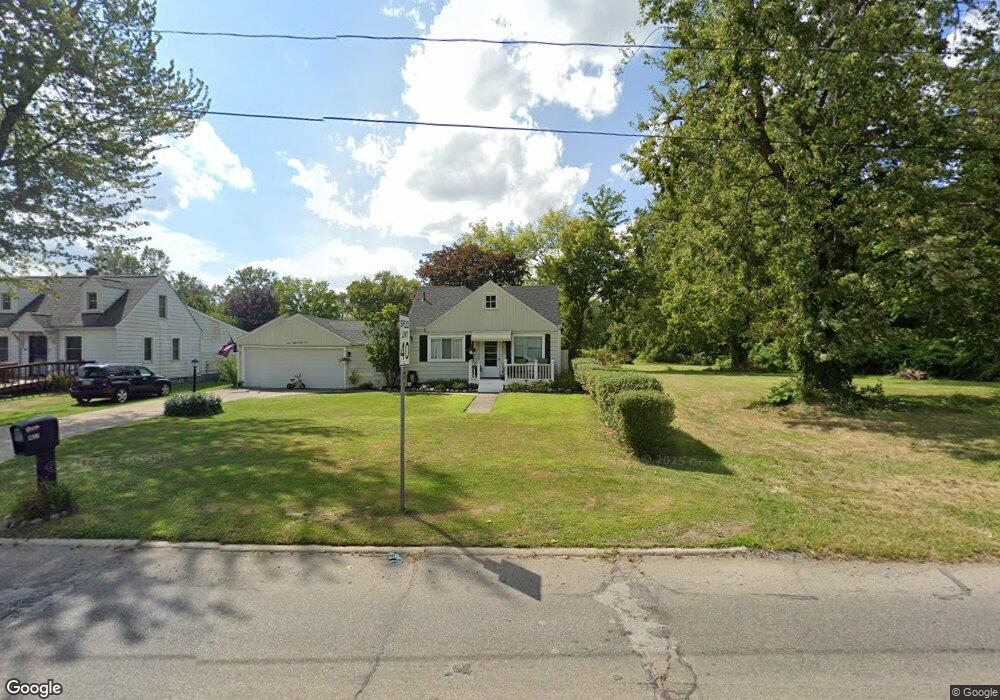
4832 S Inkster Rd Westland, MI 48186
Estimated Value: $60,000 - $130,000
--
Bed
1
Bath
650
Sq Ft
$157/Sq Ft
Est. Value
About This Home
This home is located at 4832 S Inkster Rd, Westland, MI 48186 and is currently estimated at $102,234, approximately $157 per square foot. 4832 S Inkster Rd is a home located in Wayne County with nearby schools including Taylor Parks Elementary School, Hoover Middle School, and Taylor High School.
Ownership History
Date
Name
Owned For
Owner Type
Purchase Details
Closed on
Nov 24, 2021
Sold by
Blackburn Andrea L and Cook Andrea L
Bought by
Peters Steven
Current Estimated Value
Home Financials for this Owner
Home Financials are based on the most recent Mortgage that was taken out on this home.
Original Mortgage
$88,780
Outstanding Balance
$81,687
Interest Rate
3.14%
Mortgage Type
New Conventional
Estimated Equity
$20,547
Purchase Details
Closed on
Nov 12, 2019
Sold by
Blackburn William S and Blackburn William Spencer
Bought by
Blackburn Andrea L and Cook Andrea L
Purchase Details
Closed on
Sep 20, 2007
Sold by
Federal Home Services Inc
Bought by
Blackburn William S
Purchase Details
Closed on
Dec 7, 2005
Sold by
Stockdale Althea V
Bought by
Jpmorgan Chase Bank
Purchase Details
Closed on
Apr 14, 1997
Sold by
Mcgin Beverly A and Mcgin Dennis
Bought by
Althea V Stockdale
Create a Home Valuation Report for This Property
The Home Valuation Report is an in-depth analysis detailing your home's value as well as a comparison with similar homes in the area
Home Values in the Area
Average Home Value in this Area
Purchase History
| Date | Buyer | Sale Price | Title Company |
|---|---|---|---|
| Peters Steven | $92,000 | None Available | |
| Blackburn Andrea L | -- | None Available | |
| Blackburn William S | $65,000 | Alpha Title Agency Inc | |
| Jpmorgan Chase Bank | $60,000 | None Available | |
| Althea V Stockdale | $20,000 | -- |
Source: Public Records
Mortgage History
| Date | Status | Borrower | Loan Amount |
|---|---|---|---|
| Open | Peters Steven | $88,780 |
Source: Public Records
Tax History Compared to Growth
Tax History
| Year | Tax Paid | Tax Assessment Tax Assessment Total Assessment is a certain percentage of the fair market value that is determined by local assessors to be the total taxable value of land and additions on the property. | Land | Improvement |
|---|---|---|---|---|
| 2025 | $1,645 | $50,000 | $0 | $0 |
| 2024 | $1,645 | $49,200 | $0 | $0 |
| 2023 | $1,416 | $40,200 | $0 | $0 |
| 2022 | $1,614 | $34,100 | $0 | $0 |
| 2021 | $850 | $28,700 | $0 | $0 |
| 2020 | $838 | $22,600 | $0 | $0 |
| 2019 | $1,646 | $19,700 | $0 | $0 |
| 2018 | $623 | $18,000 | $0 | $0 |
| 2017 | $319 | $16,300 | $0 | $0 |
| 2016 | $734 | $16,500 | $0 | $0 |
| 2015 | $1,626 | $16,260 | $0 | $0 |
| 2013 | $1,766 | $18,110 | $0 | $0 |
| 2012 | $895 | $18,220 | $0 | $0 |
Source: Public Records
Map
Nearby Homes
- 27523 Powers St
- 4133 Moore St
- 27285 Colgate St
- 5526 Sylvia St
- 4061 Wellington St
- 4054 Moore St
- 27022 Colgate St
- 4863 Glenis St
- POWERS Powers St
- 4120 Ash St
- 26773 Colgate St
- 3925 Spruce St
- 26916 Andover St
- 26860 Andover St
- 26532 Powers Ave
- 3861 Wellington St
- 26458 Hopkins St
- 26439 Hopkins St
- 4110 John Daly St
- Vacant Spruce St
- 4820 S Inkster Rd
- 4848 S Inkster Rd
- 4804 S Inkster Rd
- LOT 71 Eton
- 4926 S Inkster Rd
- 27448 Eton St
- 4940 S Inkster Rd
- 27462 Eton St
- 27445 Eton St
- 4954 S Inkster Rd
- 27512 Eton St
- 0000 Annapolis
- 0000 S Inkster
- 0000 Inkster Rd
- 27453 Annapolis Rd
- 27509 Eton St
- 27530 Eton St
- 0 Annapolis Unit 869003
- 34429 Annapolis St
- 27529 Eton St