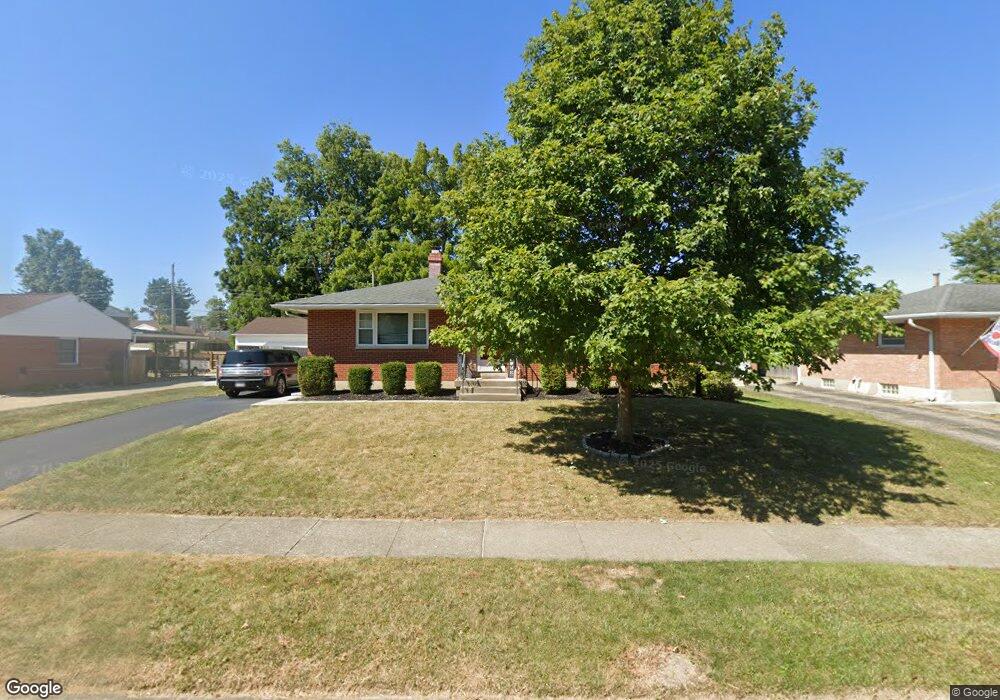
4833 Archmore Dr Dayton, OH 45440
Estimated Value: $234,039 - $266,000
3
Beds
2
Baths
1,025
Sq Ft
$248/Sq Ft
Est. Value
About This Home
This home is located at 4833 Archmore Dr, Dayton, OH 45440 and is currently estimated at $254,510, approximately $248 per square foot. 4833 Archmore Dr is a home located in Montgomery County with nearby schools including John F. Kennedy Elementary School, Kettering Middle School, and Kettering Fairmont High School.
Ownership History
Date
Name
Owned For
Owner Type
Purchase Details
Closed on
Mar 7, 2016
Sold by
Barbara L Schweickart
Bought by
Paynton Charles
Current Estimated Value
Home Financials for this Owner
Home Financials are based on the most recent Mortgage that was taken out on this home.
Original Mortgage
$113,490
Outstanding Balance
$89,056
Interest Rate
3.64%
Estimated Equity
$165,454
Purchase Details
Closed on
Mar 4, 2016
Sold by
Schweickart Barbara L
Bought by
Paynton Charles K
Home Financials for this Owner
Home Financials are based on the most recent Mortgage that was taken out on this home.
Original Mortgage
$113,490
Outstanding Balance
$89,056
Interest Rate
3.64%
Estimated Equity
$165,454
Purchase Details
Closed on
Aug 13, 2003
Sold by
Schweickart William E and Schweickart Barbara L
Bought by
Schweickart William E and Schweickart Barbara L
Create a Home Valuation Report for This Property
The Home Valuation Report is an in-depth analysis detailing your home's value as well as a comparison with similar homes in the area
Home Values in the Area
Average Home Value in this Area
Purchase History
| Date | Buyer | Sale Price | Title Company |
|---|---|---|---|
| Paynton Charles | -- | -- | |
| Paynton Charles K | $117,000 | -- | |
| Schweickart William E | -- | -- |
Source: Public Records
Mortgage History
| Date | Status | Borrower | Loan Amount |
|---|---|---|---|
| Open | Paynton Charles K | $113,490 | |
| Closed | Paynton Charles K | -- | |
| Closed | Paynton Charles K | -- |
Source: Public Records
Tax History
| Year | Tax Paid | Tax Assessment Tax Assessment Total Assessment is a certain percentage of the fair market value that is determined by local assessors to be the total taxable value of land and additions on the property. | Land | Improvement |
|---|---|---|---|---|
| 2025 | $4,105 | $64,290 | $14,990 | $49,300 |
| 2024 | $3,988 | $64,290 | $14,990 | $49,300 |
| 2023 | $3,988 | $64,290 | $14,990 | $49,300 |
| 2022 | $3,756 | $47,880 | $11,190 | $36,690 |
| 2021 | $3,474 | $47,880 | $11,190 | $36,690 |
| 2020 | $3,486 | $47,880 | $11,190 | $36,690 |
| 2019 | $3,569 | $43,370 | $10,190 | $33,180 |
| 2018 | $3,588 | $43,370 | $10,190 | $33,180 |
| 2017 | $3,304 | $43,370 | $10,190 | $33,180 |
| 2016 | $2,390 | $38,150 | $10,190 | $27,960 |
| 2015 | $2,283 | $38,150 | $10,190 | $27,960 |
| 2014 | $2,283 | $38,150 | $10,190 | $27,960 |
| 2012 | -- | $41,570 | $10,210 | $31,360 |
Source: Public Records
Map
Nearby Homes
- 4796 Archmore Dr
- 4731 Ridgebury Dr
- 4603 Croftshire Dr
- 4769 Bigger Rd
- 4678 Bigger Rd
- 5172 Polen Dr
- 2174 Belloak Dr
- 5195 Bigger Rd
- 2051 Hamlet Dr
- 5136 Creekmore Ct
- 2433 E Rahn Rd
- 4351 Sillman Place
- 5335 Glendon Ln
- 5324 Glendon Ln
- 4524 Drayton Ct
- 5336 Red Coach Rd
- 978 Marycrest Ln
- 4190 Woodman Dr
- 2648 Parklawn Dr
- 4307 Meadowcroft Rd
- 4821 Archmore Dr
- 4845 Archmore Dr
- 4809 Archmore Dr
- 4857 Archmore Dr
- 4702 Croftshire Dr
- 4832 Archmore Dr
- 4844 Archmore Dr
- 4797 Archmore Dr
- 4869 Archmore Dr
- 4682 Croftshire Dr
- 4820 Archmore Dr
- 4856 Archmore Dr
- 4808 Archmore Dr
- 4676 Croftshire Dr
- 4868 Archmore Dr
- 4672 Croftshire Dr
- 4678 Croftshire Dr
- 4785 Archmore Dr
- 4674 Croftshire Dr
- 4881 Archmore Dr
Your Personal Tour Guide
Ask me questions while you tour the home.