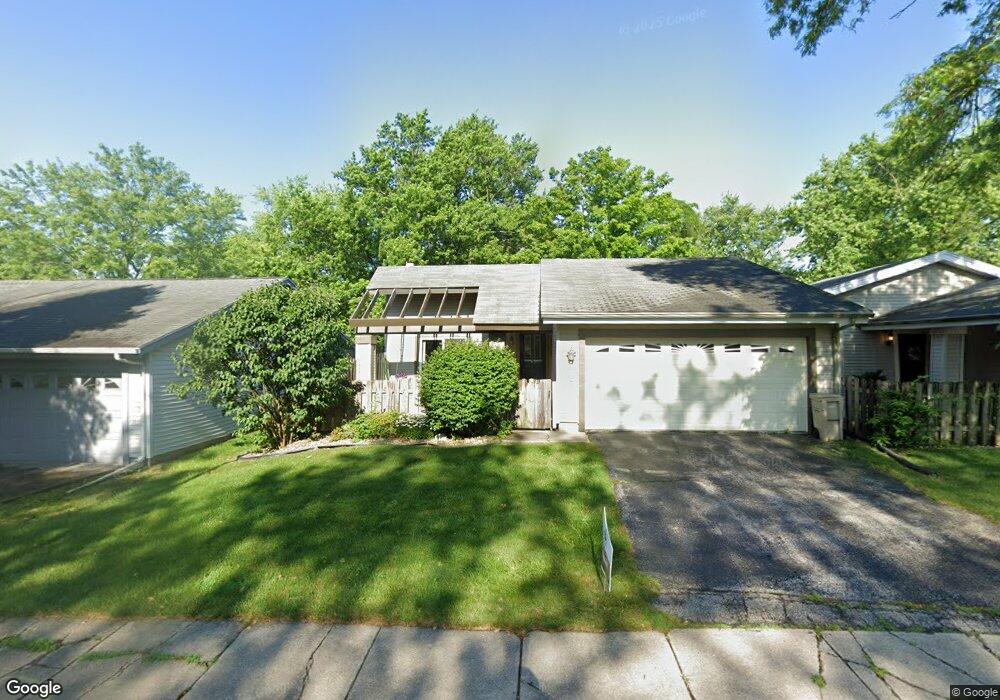
4833 Kintyre Dr Unit 1 South Bend, IN 46614
Scottsdale NeighborhoodEstimated Value: $146,000 - $193,112
2
Beds
2
Baths
1,360
Sq Ft
$128/Sq Ft
Est. Value
About This Home
This home is located at 4833 Kintyre Dr Unit 1, South Bend, IN 46614 and is currently estimated at $174,278, approximately $128 per square foot. 4833 Kintyre Dr Unit 1 is a home located in St. Joseph County with nearby schools including Marshall Traditional School, Hay Elementary School, and Clay Intermediate Center.
Ownership History
Date
Name
Owned For
Owner Type
Purchase Details
Closed on
May 6, 2019
Sold by
Unknown
Bought by
Lipowski Patricia A and Lipowski Lonnie
Current Estimated Value
Purchase Details
Closed on
May 2, 2019
Sold by
Lipowski Patricia A
Bought by
Lipowski Patricia A and Lipowski Lonnie
Purchase Details
Closed on
May 17, 2012
Sold by
Lowe Patricia A
Bought by
Melton Marilyn E and Melton Brian D
Purchase Details
Closed on
Apr 28, 2011
Sold by
Wegner Margaret J
Bought by
Lowe Patricia A
Home Financials for this Owner
Home Financials are based on the most recent Mortgage that was taken out on this home.
Original Mortgage
$25,000
Interest Rate
4.88%
Mortgage Type
New Conventional
Purchase Details
Closed on
Feb 10, 2005
Sold by
Wegner Margaret J
Bought by
Wegner Margaret J
Create a Home Valuation Report for This Property
The Home Valuation Report is an in-depth analysis detailing your home's value as well as a comparison with similar homes in the area
Home Values in the Area
Average Home Value in this Area
Purchase History
| Date | Buyer | Sale Price | Title Company |
|---|---|---|---|
| Lipowski Patricia A | -- | None Listed On Document | |
| Lipowski Patricia A | -- | None Available | |
| Melton Marilyn E | -- | None Available | |
| Melton Marilyn E | -- | None Available | |
| Lowe Patricia A | -- | Metropolitan Title In Llc | |
| Wegner Margaret J | -- | None Available |
Source: Public Records
Mortgage History
| Date | Status | Borrower | Loan Amount |
|---|---|---|---|
| Previous Owner | Lowe Patricia A | $25,000 |
Source: Public Records
Tax History Compared to Growth
Tax History
| Year | Tax Paid | Tax Assessment Tax Assessment Total Assessment is a certain percentage of the fair market value that is determined by local assessors to be the total taxable value of land and additions on the property. | Land | Improvement |
|---|---|---|---|---|
| 2024 | $35 | $147,600 | $21,300 | $126,300 |
| 2023 | $35 | $135,300 | $21,300 | $114,000 |
| 2022 | $0 | $135,300 | $21,300 | $114,000 |
| 2021 | $35 | $113,100 | $10,500 | $102,600 |
| 2020 | $35 | $100,300 | $9,300 | $91,000 |
| 2019 | $35 | $97,600 | $9,000 | $88,600 |
| 2018 | $35 | $87,900 | $7,500 | $80,400 |
| 2017 | $33 | $84,900 | $7,500 | $77,400 |
| 2016 | $33 | $84,900 | $7,500 | $77,400 |
| 2014 | -- | $69,400 | $6,200 | $63,200 |
Source: Public Records
Map
Nearby Homes
- 1951 Broadford Dr
- 1957 Broadford Dr
- 1725 Thornhill Dr
- 1719 Thornhill Dr
- 4622 E Macgregor Rd
- 4555 Macdougall Ct
- 1515 Strathmore Ct
- 4909 Selkirk Dr
- 1512 Oakdale Dr
- 1413 Orkney Ct
- 4312 Sampson St
- 1426 Oakdale Dr
- 1826 Overlook Ct
- 17746 Hartman St
- 4039 Coral Dr
- 4015 Coral Dr
- 4108 Woodvale Dr
- 1961 E Farnsworth Dr
- 1225 Fairfax Dr
- 1834 Saint Michaels Ct
- 4833 Kintyre Dr
- 4843 Kintyre Dr
- 4825 Kintyre Dr
- 4821 Kintyre Dr
- 1837 Thornhill Dr
- 1926 Greenock St
- 4846 Huntley Ct
- 1923 Thornhill Dr
- 4840 Huntley Ct
- 1925 Thornhill Dr
- 1928 Greenock St
- 1909 Greenock St
- 4854 Huntley Ct
- 1930 Greenock St
- 1927 Thornhill Dr
- 4834 Huntley Ct
- 1904 Thornhill Dr
- 1911 Greenock St
- 1929 Thornhill Dr
- 1932 Greenock St