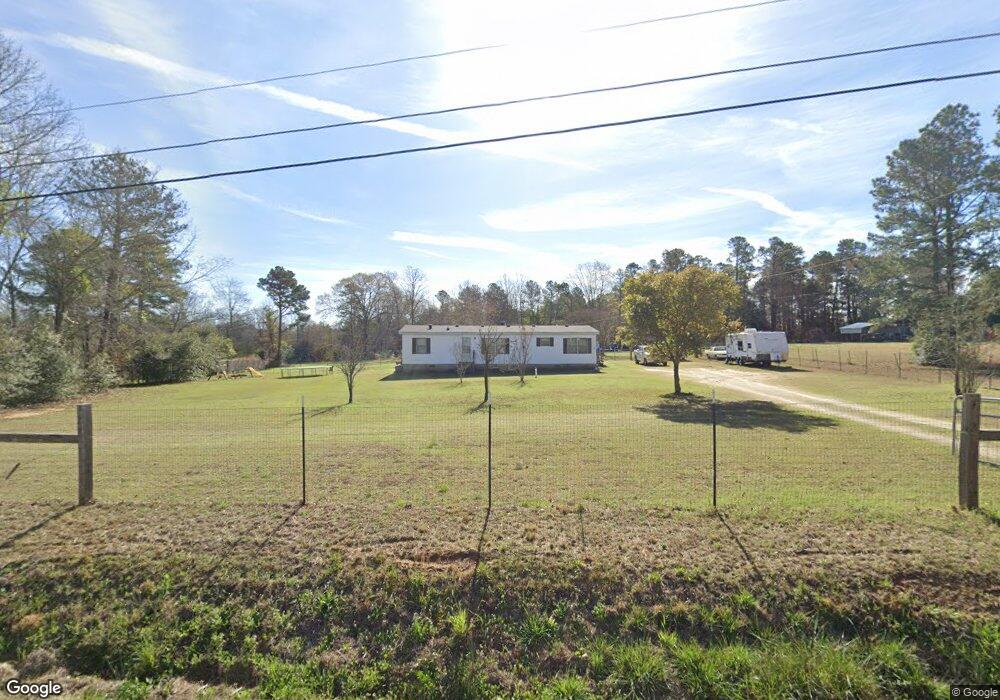
4834 Franklin Covenant Rd Hephzibah, GA 30815
Estimated Value: $141,000 - $177,000
--
Bed
--
Bath
1,568
Sq Ft
$102/Sq Ft
Est. Value
About This Home
This home is located at 4834 Franklin Covenant Rd, Hephzibah, GA 30815 and is currently estimated at $159,529, approximately $101 per square foot. 4834 Franklin Covenant Rd is a home located in Richmond County with nearby schools including Hephzibah Middle School, Johnson Magnet, and Hephzibah High School.
Ownership History
Date
Name
Owned For
Owner Type
Purchase Details
Closed on
Jun 19, 2019
Sold by
Adams Ronald T
Bought by
Wood Kenneth W and Wood Tiffany M
Current Estimated Value
Home Financials for this Owner
Home Financials are based on the most recent Mortgage that was taken out on this home.
Original Mortgage
$81,607
Outstanding Balance
$71,456
Interest Rate
4%
Mortgage Type
New Conventional
Estimated Equity
$88,073
Purchase Details
Closed on
Jan 26, 2018
Sold by
Michael Michael Ken Ken
Bought by
Adams Ronald T and Adams Sherry L
Home Financials for this Owner
Home Financials are based on the most recent Mortgage that was taken out on this home.
Original Mortgage
$57,150
Interest Rate
3.99%
Mortgage Type
New Conventional
Purchase Details
Closed on
Apr 25, 2017
Sold by
Borren Sterling Jay
Bought by
Michael Ken
Purchase Details
Closed on
Sep 17, 2010
Sold by
Borren Carol
Bought by
Borren Sterling J
Purchase Details
Closed on
Apr 15, 2010
Sold by
Borren Carol
Bought by
Sorren Sterling J
Create a Home Valuation Report for This Property
The Home Valuation Report is an in-depth analysis detailing your home's value as well as a comparison with similar homes in the area
Home Values in the Area
Average Home Value in this Area
Purchase History
| Date | Buyer | Sale Price | Title Company |
|---|---|---|---|
| Wood Kenneth W | $90,675 | -- | |
| Adams Ronald T | $63,500 | -- | |
| Michael Ken | -- | -- | |
| Borren Sterling J | -- | -- | |
| Sorren Sterling J | -- | -- |
Source: Public Records
Mortgage History
| Date | Status | Borrower | Loan Amount |
|---|---|---|---|
| Open | Wood Kenneth W | $81,607 | |
| Previous Owner | Adams Ronald T | $57,150 |
Source: Public Records
Tax History Compared to Growth
Tax History
| Year | Tax Paid | Tax Assessment Tax Assessment Total Assessment is a certain percentage of the fair market value that is determined by local assessors to be the total taxable value of land and additions on the property. | Land | Improvement |
|---|---|---|---|---|
| 2024 | $896 | $22,730 | $10,476 | $12,254 |
| 2023 | $321 | $22,108 | $10,476 | $11,632 |
| 2022 | $736 | $20,181 | $10,476 | $9,705 |
| 2021 | $777 | $20,181 | $10,476 | $9,705 |
| 2020 | $764 | $20,044 | $10,476 | $9,568 |
| 2019 | $499 | $20,040 | $10,476 | $9,564 |
| 2018 | $965 | $20,060 | $10,476 | $9,584 |
| 2017 | $311 | $19,852 | $10,476 | $9,376 |
| 2016 | $433 | $19,606 | $10,476 | $9,130 |
| 2015 | $434 | $19,682 | $10,476 | $9,206 |
| 2014 | $428 | $19,245 | $10,476 | $8,769 |
Source: Public Records
Map
Nearby Homes
- 5298 Henderson Rd
- 2160 Louisa Rd
- 1351 Hephzibah - McBean Rd
- 1503 Hephzibah - McBean Rd
- 4715 Storey Mill Rd
- Elmsgate Plan at The Town Homes at Diamond Lakes - Townhomes at Diamond Lakes
- Langdon Plan at The Town Homes at Diamond Lakes - Townhomes at Diamond Lakes
- Primrose Plan at The Town Homes at Diamond Lakes - Townhomes at Diamond Lakes
- Lincoln Plan at The Town Homes at Diamond Lakes - Townhomes at Diamond Lakes
- 1027 Grindstone Creek Rd
- 2016 Elite Ct
- 5007 Peach Orchard Rd
- 2010 McCoy Mill Rd
- 1515B Hephzibah - McBean Rd
- 2424 Mims Rd
- 2250 Hephzibah - McBean Rd
- 1515H Hephzibah - McBean Rd
- 1515G Hephzibah - McBean Rd
- 4585 Old Waynesboro Rd
- 1515C Hephzibah - McBean Rd
- 4832 Franklin Covenant Rd
- 4832A Franklin Covenant Rd
- 4817 Franklin Covenant Rd
- 4815 Franklin Covenant Rd
- 4814 Franklin Covenant Rd
- 4809 Franklin Covenant Rd
- 1869 Hephzibah McBean Rd
- 4822 Franklin Covenant Rd
- 1877 Hephzibah McBean Rd
- 4810 Franklin Covenant Rd
- 1861 Hephzibah McBean Rd
- 1855 Hephzibah McBean Rd
- 1903 Hephzibah McBean Rd
- 1855 Hephzibah - McBean Rd
- 4812 Franklin Covenant Rd
- 1909 Hephzibah McBean Rd
- 1845 Hephzibah McBean Rd
- 1849 Hephzibah McBean Rd
- 1851 Hephzibah McBean Rd
- 1915 Hephzibah McBean Rd