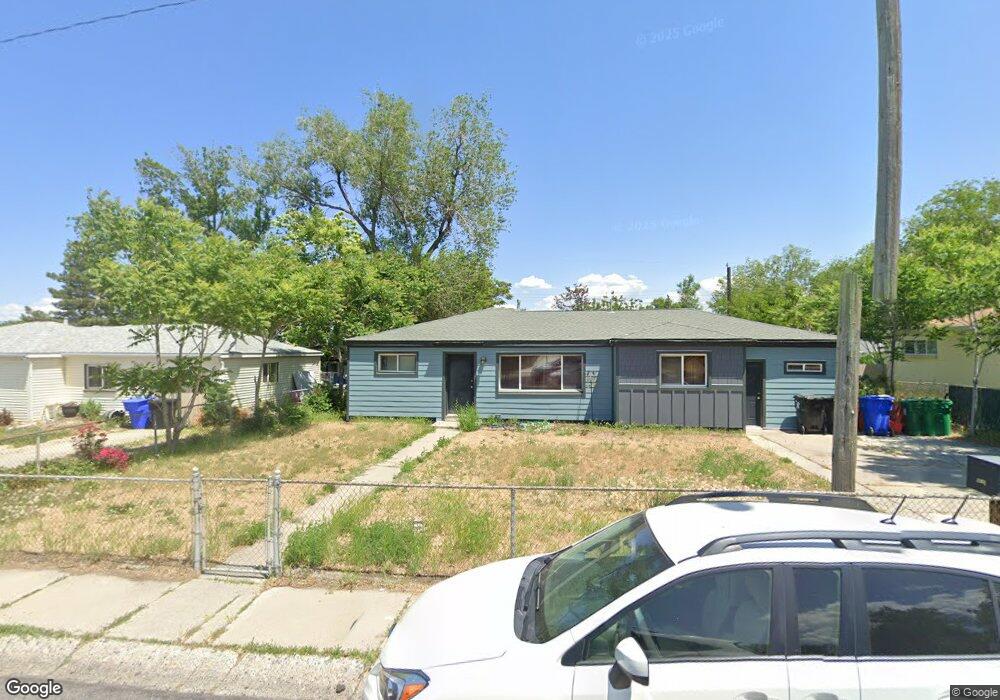
4835 S 4420 W Salt Lake City, UT 84118
Estimated Value: $383,000 - $414,000
3
Beds
2
Baths
1,454
Sq Ft
$277/Sq Ft
Est. Value
About This Home
This home is located at 4835 S 4420 W, Salt Lake City, UT 84118 and is currently estimated at $402,360, approximately $276 per square foot. 4835 S 4420 W is a home located in Salt Lake County with nearby schools including David Gourley Elementary School, Kearns Jr High School, and Kearns High School.
Ownership History
Date
Name
Owned For
Owner Type
Purchase Details
Closed on
Oct 13, 2016
Sold by
Campbell Ethan N
Bought by
Forsgren Joshua D
Current Estimated Value
Home Financials for this Owner
Home Financials are based on the most recent Mortgage that was taken out on this home.
Original Mortgage
$180,175
Outstanding Balance
$147,949
Interest Rate
4.25%
Mortgage Type
FHA
Estimated Equity
$254,411
Purchase Details
Closed on
Nov 27, 2012
Sold by
Trp Investments Llc
Bought by
Campbell Ethan N
Home Financials for this Owner
Home Financials are based on the most recent Mortgage that was taken out on this home.
Original Mortgage
$125,189
Interest Rate
3.25%
Mortgage Type
FHA
Purchase Details
Closed on
Feb 24, 1997
Sold by
Thornton George R and Thornton Lupie Ann
Bought by
Thornton George R and Thornton Lupie Ann
Create a Home Valuation Report for This Property
The Home Valuation Report is an in-depth analysis detailing your home's value as well as a comparison with similar homes in the area
Home Values in the Area
Average Home Value in this Area
Purchase History
| Date | Buyer | Sale Price | Title Company |
|---|---|---|---|
| Forsgren Joshua D | -- | Meridian Title | |
| Campbell Ethan N | -- | Eagle Gate Title Ins Agcy | |
| Thornton George R | -- | -- |
Source: Public Records
Mortgage History
| Date | Status | Borrower | Loan Amount |
|---|---|---|---|
| Open | Forsgren Joshua D | $180,175 | |
| Previous Owner | Campbell Ethan N | $125,189 |
Source: Public Records
Tax History Compared to Growth
Tax History
| Year | Tax Paid | Tax Assessment Tax Assessment Total Assessment is a certain percentage of the fair market value that is determined by local assessors to be the total taxable value of land and additions on the property. | Land | Improvement |
|---|---|---|---|---|
| 2025 | $3,275 | $372,400 | $79,900 | $292,500 |
| 2024 | $3,275 | $348,900 | $75,100 | $273,800 |
| 2023 | $2,768 | $310,000 | $72,100 | $237,900 |
| 2022 | $2,716 | $322,100 | $70,800 | $251,300 |
| 2021 | $2,196 | $264,100 | $54,400 | $209,700 |
| 2020 | $2,106 | $226,900 | $49,600 | $177,300 |
| 2019 | $1,969 | $218,900 | $46,800 | $172,100 |
| 2018 | $1,939 | $197,800 | $46,800 | $151,000 |
| 2017 | $1,611 | $171,900 | $46,800 | $125,100 |
| 2016 | $1,284 | $144,400 | $43,100 | $101,300 |
| 2015 | $1,423 | $149,000 | $55,400 | $93,600 |
| 2014 | $1,330 | $136,200 | $51,400 | $84,800 |
Source: Public Records
Map
Nearby Homes