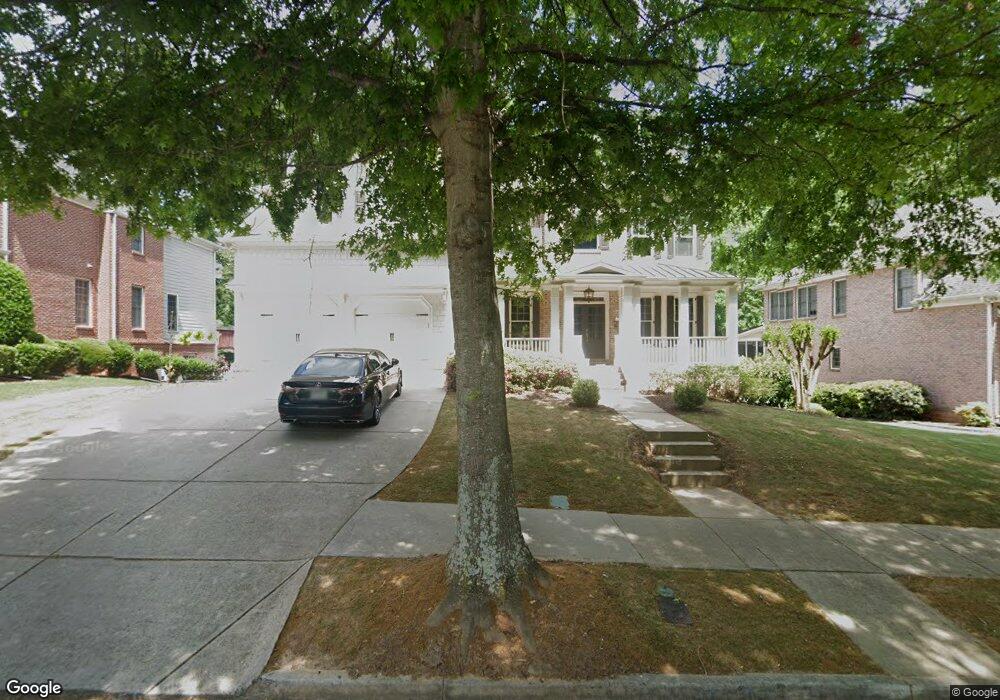
4835 Spring Park Cir Suwanee, GA 30024
Estimated Value: $788,715 - $1,009,000
4
Beds
4
Baths
3,502
Sq Ft
$254/Sq Ft
Est. Value
About This Home
This home is located at 4835 Spring Park Cir, Suwanee, GA 30024 and is currently estimated at $888,179, approximately $253 per square foot. 4835 Spring Park Cir is a home located in Gwinnett County with nearby schools including Level Creek Elementary School, North Gwinnett Middle School, and North Gwinnett High School.
Ownership History
Date
Name
Owned For
Owner Type
Purchase Details
Closed on
Jul 7, 2014
Sold by
Baker Alison
Bought by
Baker Brian J
Current Estimated Value
Home Financials for this Owner
Home Financials are based on the most recent Mortgage that was taken out on this home.
Original Mortgage
$348,000
Outstanding Balance
$256,375
Interest Rate
3.31%
Mortgage Type
New Conventional
Estimated Equity
$631,804
Purchase Details
Closed on
Dec 31, 2001
Sold by
Peachtree Residential Prop
Bought by
Baker Brian and Baker Alison
Home Financials for this Owner
Home Financials are based on the most recent Mortgage that was taken out on this home.
Original Mortgage
$300,000
Interest Rate
6%
Mortgage Type
New Conventional
Create a Home Valuation Report for This Property
The Home Valuation Report is an in-depth analysis detailing your home's value as well as a comparison with similar homes in the area
Home Values in the Area
Average Home Value in this Area
Purchase History
| Date | Buyer | Sale Price | Title Company |
|---|---|---|---|
| Baker Brian J | -- | -- | |
| Baker Brian | $345,500 | -- |
Source: Public Records
Mortgage History
| Date | Status | Borrower | Loan Amount |
|---|---|---|---|
| Open | Baker Brian J | $348,000 | |
| Previous Owner | Baker Brian | $300,000 |
Source: Public Records
Tax History Compared to Growth
Tax History
| Year | Tax Paid | Tax Assessment Tax Assessment Total Assessment is a certain percentage of the fair market value that is determined by local assessors to be the total taxable value of land and additions on the property. | Land | Improvement |
|---|---|---|---|---|
| 2024 | $8,052 | $290,280 | $64,800 | $225,480 |
| 2023 | $8,052 | $292,680 | $64,800 | $227,880 |
| 2022 | $7,214 | $250,720 | $64,800 | $185,920 |
| 2021 | $6,541 | $212,160 | $42,560 | $169,600 |
| 2020 | $6,591 | $212,160 | $42,560 | $169,600 |
| 2019 | $6,047 | $194,840 | $38,800 | $156,040 |
| 2018 | $5,634 | $175,040 | $38,800 | $136,240 |
| 2016 | $5,559 | $170,520 | $45,200 | $125,320 |
| 2015 | $5,612 | $170,520 | $45,200 | $125,320 |
| 2014 | $5,495 | $163,800 | $45,200 | $118,600 |
Source: Public Records
Map
Nearby Homes
- 4770 Spring Park Cir
- 4763 Blackwater Way
- 5014 Dovecote Trail
- 962 Chattooga Trace
- 878 Middle Fork Trail
- 4734 Cuyahoga Cove
- 4944 Dovecote Trail
- 4891 Tarry Post Ln
- 929 Middle Fork Trail
- 3768 Spruce Ridge Ln
- 829 Big Horn Hollow
- 4635 Whitestone Way
- 989 Middle Fork Trail
- 1078 Crescent River Pass
- 4874 Kettle River Point
- 4844 Elkhorn Hill Dr
- 4505 Whitestone Way
- 4825 Spring Park Cir
- 4845 Spring Park Cir
- 4855 Spring Park Cir
- 4815 Spring Park Cir
- 4830 Spring Park Cir
- 4820 Spring Park Cir
- 4865 Spring Park Cir Unit 6C
- 4810 Spring Park Cir
- 4805 Spring Park Cir Unit C
- 4850 Spring Park Cir
- 952 Spring Park Ln Unit 6B
- 4790 Spring Park Cir Unit 6C
- 962 Spring Park Ln
- 5187 Dovecote Trail Unit 6C
- 4875 Spring Park Cir
- 942 Spring Park Ln Unit 6B
- 972 Spring Park Ln
- 0 Spring Park Cir Unit 7432255
- 0 Spring Park Cir Unit 7423898
- 0 Spring Park Cir Unit 7415008