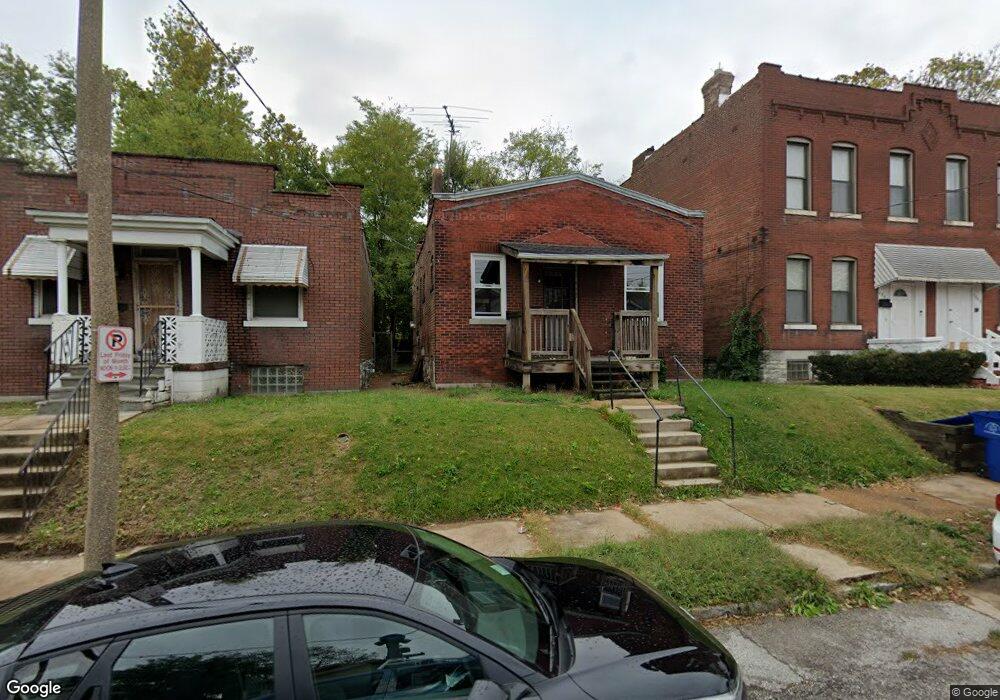
4838 Palm St Saint Louis, MO 63115
Kingsway NeighborhoodEstimated Value: $46,972 - $70,000
--
Bed
1
Bath
1,764
Sq Ft
$32/Sq Ft
Est. Value
About This Home
This home is located at 4838 Palm St, Saint Louis, MO 63115 and is currently estimated at $56,493, approximately $32 per square foot. 4838 Palm St is a home located in St. Louis City with nearby schools including Lexington Elementary School, Sumner High School, and North Side Community Elementary School.
Ownership History
Date
Name
Owned For
Owner Type
Purchase Details
Closed on
Dec 20, 2024
Sold by
Jeffries Ellen and Thomas Tessa
Bought by
Jeffries Harold
Current Estimated Value
Purchase Details
Closed on
Dec 19, 2024
Sold by
Jeffries Investment Corporation
Bought by
Market Life Realty Llc
Purchase Details
Closed on
Jun 23, 2011
Sold by
Jeffries Sylvia A
Bought by
The Jeffries Investment Corporation
Purchase Details
Closed on
Apr 6, 1998
Sold by
Thomas Clarice H
Bought by
Jeffries Harold and Jeffries Sylvia A
Create a Home Valuation Report for This Property
The Home Valuation Report is an in-depth analysis detailing your home's value as well as a comparison with similar homes in the area
Home Values in the Area
Average Home Value in this Area
Purchase History
| Date | Buyer | Sale Price | Title Company |
|---|---|---|---|
| Jeffries Harold | -- | None Listed On Document | |
| Henderson Jashua | -- | Investors Title Company | |
| Jeffries Investment Corporation | -- | Investors Title Company | |
| Jeffries Aaron T | -- | None Listed On Document | |
| Jeffries Harold | -- | None Listed On Document | |
| Henderson Jashua | -- | Investors Title Company | |
| Jeffries Investment Corporation | -- | Investors Title Company | |
| Jeffries Aaron T | -- | None Listed On Document | |
| Jeffries Harold | -- | None Listed On Document | |
| Market Life Realty Llc | -- | Investors Title Company | |
| Market Life Realty Llc | -- | Investors Title Company | |
| Thomas Tessa | -- | None Listed On Document | |
| Market Life Realty Llc | -- | Investors Title Company | |
| Thomas Tessa | -- | None Listed On Document | |
| The Jeffries Investment Corporation | -- | None Available | |
| The Jeffries Investment Corporation | -- | None Available | |
| Jeffries Harold | -- | -- |
Source: Public Records
Tax History Compared to Growth
Tax History
| Year | Tax Paid | Tax Assessment Tax Assessment Total Assessment is a certain percentage of the fair market value that is determined by local assessors to be the total taxable value of land and additions on the property. | Land | Improvement |
|---|---|---|---|---|
| 2025 | $299 | $3,350 | $570 | $2,780 |
| 2024 | $286 | $3,240 | $570 | $2,670 |
| 2023 | $286 | $3,240 | $570 | $2,670 |
| 2022 | $292 | $3,190 | $570 | $2,620 |
| 2021 | $291 | $3,190 | $570 | $2,620 |
| 2020 | $289 | $3,190 | $570 | $2,620 |
| 2019 | $288 | $3,190 | $570 | $2,620 |
| 2018 | $291 | $3,120 | $570 | $2,550 |
| 2017 | $286 | $3,120 | $570 | $2,550 |
| 2016 | $302 | $3,270 | $800 | $2,470 |
| 2015 | $276 | $3,270 | $800 | $2,470 |
| 2014 | $306 | $3,270 | $800 | $2,470 |
| 2013 | -- | $3,670 | $800 | $2,870 |
Source: Public Records
Map
Nearby Homes
- 5426 N Euclid Ave
- 5483 N Euclid Ave
- 5429 N Euclid Ave
- 5437 N Euclid Ave
- 4830 Ashland Ave
- 4822 Ashland Ave
- 3332 Aubert Ave
- 4920 San Francisco Ave
- 4718 Lexington Ave
- 4903 San Francisco Ave
- 4713-4715 Natural Bridge Ave
- 4881 San Francisco Ave
- 4823 San Francisco Ave
- 4741 Greer Ave
- 4874 Margaretta Ave
- 3937-3939 N Euclid Ave
- 3068 Marcus Ave
- 4669 Elmbank Ave
- 4762 Labadie Ave
- 4755 Saint Louis Ave