Estimated Value: $299,170 - $327,000
2
Beds
2
Baths
1,218
Sq Ft
$256/Sq Ft
Est. Value
About This Home
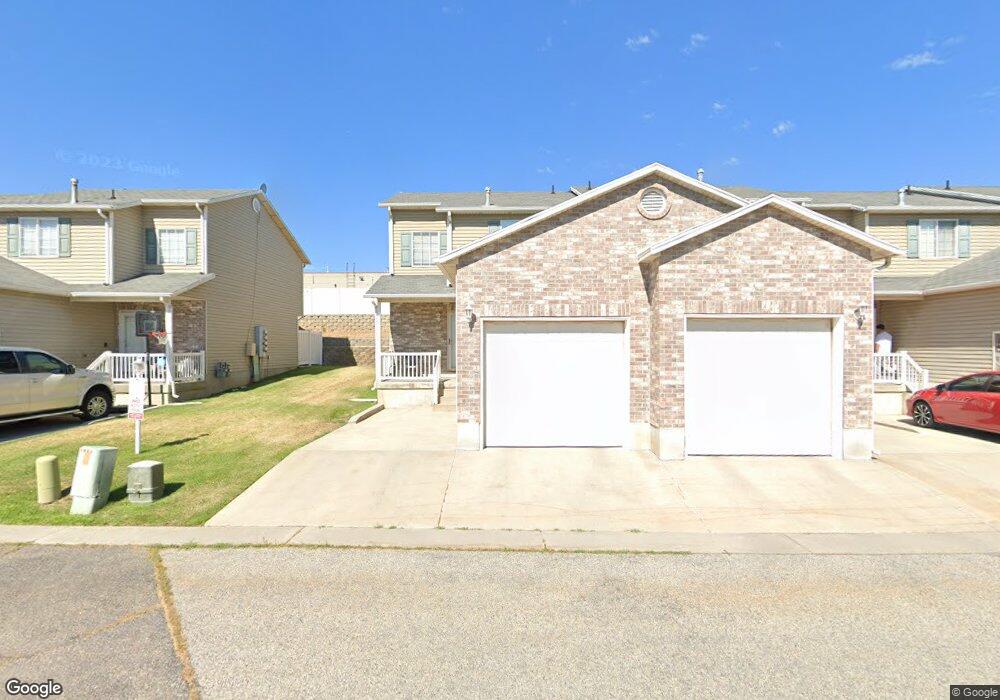
This home is located at 4839 S 1800 W Unit 29, Roy, UT 84067 and is currently estimated at $312,043, approximately $256 per square foot. 4839 S 1800 W Unit 29 is a home located in Weber County with nearby schools including Lakeview Elementary School, Roy Junior High School, and Roy High School.
Ownership History
Date
Name
Owned For
Owner Type
Purchase Details
Closed on
Aug 28, 2014
Sold by
Harrison Wynn J and Harrison Kim
Bought by
The Wynn J Harrison And Kim Harrison Rev and Harrison Kim
Current Estimated Value
Purchase Details
Closed on
Feb 27, 2012
Sold by
Harrison Kim
Bought by
Harrison Wynn J and Harrison Kim
Purchase Details
Closed on
Jul 11, 2008
Sold by
Cook Dell Jean
Bought by
Cook Dell Jean and Dell Jean Cook Revocable Living Trust
Purchase Details
Closed on
Jul 13, 2001
Sold by
T & T Management Lc
Bought by
Cook Dell Jean
Purchase Details
Closed on
Dec 27, 2000
Sold by
Koehler Mark S and Koehler Terrie A
Bought by
T & T Management Lc
Purchase Details
Closed on
Aug 2, 2000
Sold by
Crockett & Koehler Lc
Bought by
Koehler Mark S and Koehler Terrie A
Create a Home Valuation Report for This Property
The Home Valuation Report is an in-depth analysis detailing your home's value as well as a comparison with similar homes in the area
Home Values in the Area
Average Home Value in this Area
Purchase History
| Date | Buyer | Sale Price | Title Company |
|---|---|---|---|
| The Wynn J Harrison And Kim Harrison Rev | -- | None Available | |
| Harrison Wynn J | -- | Founders Title Company | |
| Harrison Kim | -- | Founders Title Company Syrac | |
| Cook Dell Jean | -- | None Available | |
| Cook Dell Jean | -- | Gateway Title | |
| T & T Management Lc | -- | Security Title | |
| Koehler Mark S | -- | Security Title |
Source: Public Records
Tax History Compared to Growth
Tax History
| Year | Tax Paid | Tax Assessment Tax Assessment Total Assessment is a certain percentage of the fair market value that is determined by local assessors to be the total taxable value of land and additions on the property. | Land | Improvement |
|---|---|---|---|---|
| 2025 | $1,763 | $310,980 | $75,000 | $235,980 |
| 2024 | $1,705 | $303,000 | $75,000 | $228,000 |
| 2023 | $1,545 | $275,000 | $75,000 | $200,000 |
| 2022 | $1,555 | $282,000 | $75,000 | $207,000 |
| 2021 | $1,319 | $218,000 | $27,000 | $191,000 |
| 2020 | $1,202 | $182,000 | $27,000 | $155,000 |
| 2019 | $1,119 | $160,000 | $25,000 | $135,000 |
| 2018 | $999 | $135,000 | $21,000 | $114,000 |
| 2017 | $1,020 | $129,900 | $21,000 | $108,900 |
| 2016 | $977 | $67,100 | $13,200 | $53,900 |
| 2015 | $894 | $63,250 | $13,200 | $50,050 |
| 2014 | $810 | $56,650 | $13,200 | $43,450 |
Source: Public Records
Map
Nearby Homes
- 5006 S 1800 W
- 1789 W 5000 S
- 1765 W 5000 S
- 1789 W 5050 S
- 1777 W 5050 S
- 1758 W 5025 S
- 2067 W 4750 S
- 4602 Hathaway Dr
- 4848 S 2125 W
- 4593 Promenade Dr
- 4642 S 1900 W Unit 41
- 2038 W 4600 S
- 1766 W 4575 S
- 2153 W 4800 S
- 2179 W 4975 S
- 5140 S 2100 W
- 1825 W 4500 S Unit 101
- 4536 S 1900 W Unit 12
- 5185 S 2100 W
- 4552 S 1675 W
- 4839 S 1800 W Unit 31
- 4839 S 1800 W Unit 30
- 4839 S 1800 W Unit 28
- 4839 S 1800 W Unit 27
- 4839 S 1800 W
- 4851 S 1800 W Unit 26
- 4851 S 1800 W Unit 25
- 4851 S 1800 W Unit 24
- 4851 S 1800 W Unit 23
- 4851 S 1800 W
- 4827 S 1800 W Unit 35
- 4827 S 1800 W Unit 34
- 4827 S 1800 W Unit 33
- 4827 S 1800 W Unit 32
- 4827 S 1800 W
- 4863 S 1800 W Unit 22
- 4863 S 1800 W Unit 21
- 4863 S 1800 W Unit 20
- 4863 S 1800 W Unit 19
- 4863 S 1800 W