484 Ashwood Bend Lufkin, TX 75904
Estimated Value: $370,000 - $392,000
3
Beds
3
Baths
2,350
Sq Ft
$162/Sq Ft
Est. Value
About This Home
This home is located at 484 Ashwood Bend, Lufkin, TX 75904 and is currently estimated at $381,345, approximately $162 per square foot. 484 Ashwood Bend is a home located in Angelina County with nearby schools including W.F. Peavy Primary School, W.H. Bonner Elementary School, and Hudson Middle School.
Ownership History
Date
Name
Owned For
Owner Type
Purchase Details
Closed on
Dec 22, 2021
Sold by
Musick Jo Anne Stubblefield and Wieting Kaye Stubblefield
Bought by
Kondroik Construction Llc
Current Estimated Value
Home Financials for this Owner
Home Financials are based on the most recent Mortgage that was taken out on this home.
Original Mortgage
$148,500
Outstanding Balance
$136,342
Interest Rate
2.98%
Mortgage Type
Purchase Money Mortgage
Estimated Equity
$245,003
Purchase Details
Closed on
May 2, 2011
Sold by
Kondroik John D and Kondroik Candace
Bought by
Turney Matthew B and Turney Brandy O
Home Financials for this Owner
Home Financials are based on the most recent Mortgage that was taken out on this home.
Original Mortgage
$258,250
Interest Rate
4.87%
Mortgage Type
VA
Create a Home Valuation Report for This Property
The Home Valuation Report is an in-depth analysis detailing your home's value as well as a comparison with similar homes in the area
Home Values in the Area
Average Home Value in this Area
Purchase History
| Date | Buyer | Sale Price | Title Company |
|---|---|---|---|
| Kondroik Construction Llc | -- | Security Guaranty Abstract | |
| Turney Matthew B | -- | None Available |
Source: Public Records
Mortgage History
| Date | Status | Borrower | Loan Amount |
|---|---|---|---|
| Open | Kondroik Construction Llc | $148,500 | |
| Previous Owner | Turney Matthew B | $258,250 |
Source: Public Records
Tax History Compared to Growth
Tax History
| Year | Tax Paid | Tax Assessment Tax Assessment Total Assessment is a certain percentage of the fair market value that is determined by local assessors to be the total taxable value of land and additions on the property. | Land | Improvement |
|---|---|---|---|---|
| 2025 | $6,991 | $390,360 | $35,280 | $355,080 |
| 2024 | $6,954 | $388,280 | $35,280 | $353,000 |
| 2023 | $6,545 | $388,800 | $35,280 | $353,520 |
| 2022 | $6,060 | $312,020 | $20,270 | $291,750 |
| 2021 | $5,920 | $284,600 | $20,270 | $264,330 |
| 2020 | $5,396 | $255,530 | $20,880 | $234,650 |
| 2019 | $5,047 | $228,900 | $20,270 | $208,630 |
| 2018 | $4,571 | $227,490 | $20,270 | $207,220 |
| 2017 | $4,571 | $219,660 | $20,270 | $199,390 |
| 2016 | $5,169 | $232,020 | $35,600 | $196,420 |
| 2015 | $4,855 | $227,420 | $35,600 | $191,820 |
| 2014 | $4,855 | $226,490 | $35,600 | $190,890 |
Source: Public Records
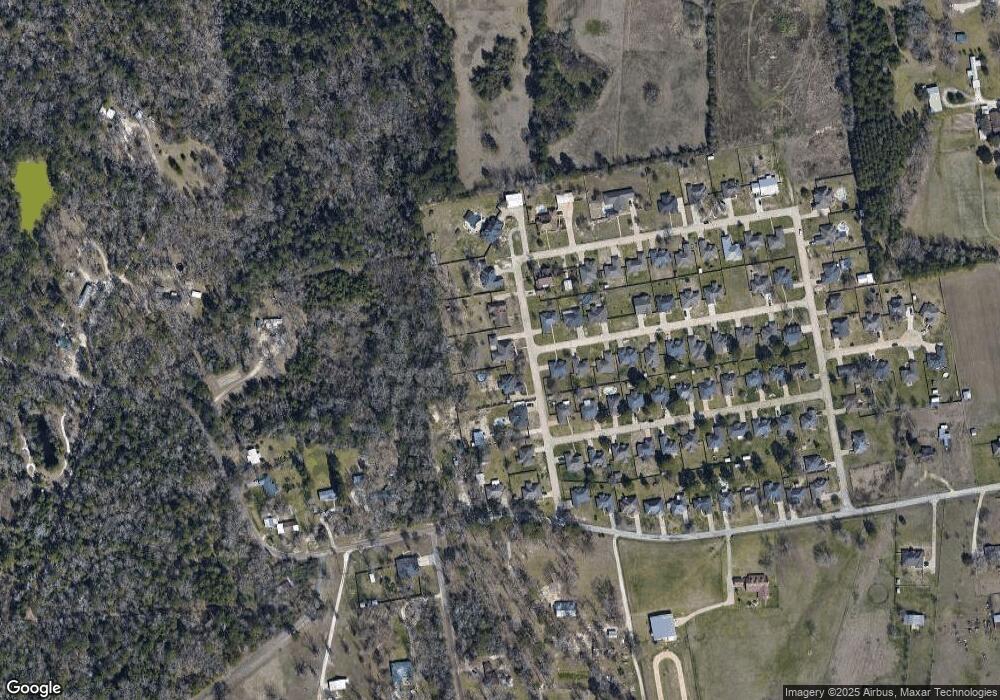
Map
Nearby Homes
- 448 Ashwood Bend
- 151 Plum Ridge
- 185 Sandalwood St
- 00 Evans-Gann Rd
- off Evans-Gann Rd
- 325 Evans Gann Rd
- 0000 Roy Christie Rd
- 465 Roper Rd
- 3202 Bethlehem Rd
- TBD James Oates Rd
- 3405 Bethlehem Rd
- 3335 Bethlehem Rd
- 4136 Bethlehem Rd
- 1370 Evans Gann Rd
- 358 Stone Dr
- 454 Bobwhite Dr
- 131 Winchester Place
- 1072 Stephenson Brown Rd
- 128 Winchester Place
- 286 Hunters Glen Dr
- 544 Ashwood Bend
- 468 Ashwood Bend
- 471 Ashwood Bend
- 543 Ashwood Bend
- 439 Ashwood Bend
- 551 Ashwood Bend
- 121 Plum Ridge
- 120 Plumridge
- 131 Plum Ridge
- 562 Ashwood Bend
- 246 Sandalwood St
- 130 Plum Ridge
- 560 Evans Gann Rd
- 438 Ashwood Bend
- 236 Sandalwood St
- 571 Ashwood Bend
- 418 Ashwood Bend
- 561 Ashwood Bend
- 140 Plum Ridge
- 572 Ashwood Bend