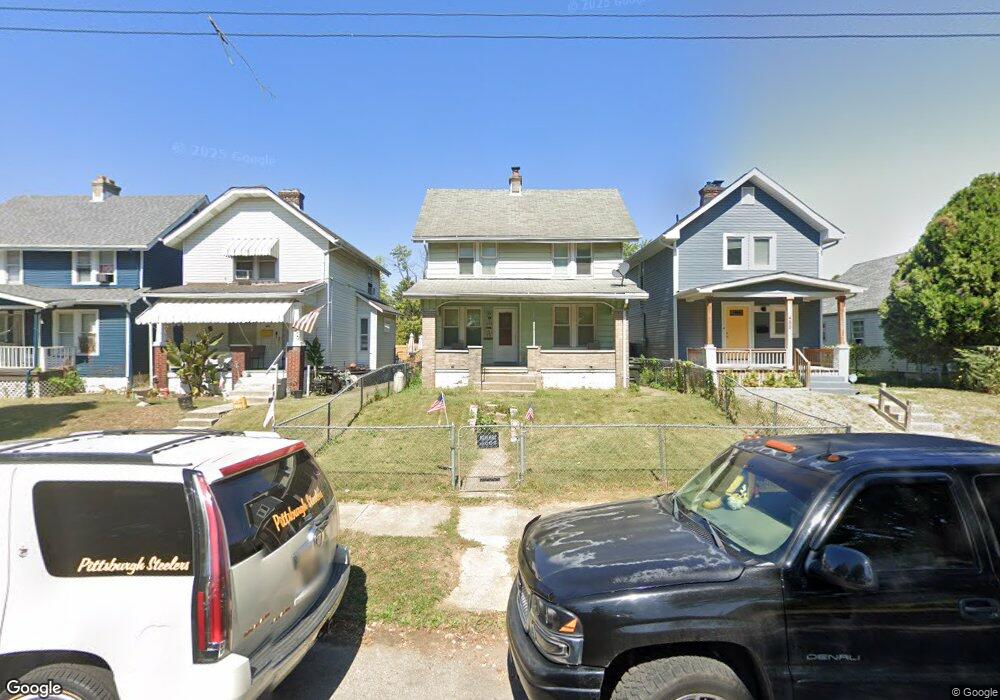
484 E Hinman Ave Columbus, OH 43207
Vassor Village NeighborhoodEstimated Value: $142,000 - $179,000
2
Beds
1
Bath
984
Sq Ft
$167/Sq Ft
Est. Value
About This Home
This home is located at 484 E Hinman Ave, Columbus, OH 43207 and is currently estimated at $164,480, approximately $167 per square foot. 484 E Hinman Ave is a home located in Franklin County with nearby schools including Lincoln Park Elementary School, South High School, and South Columbus Preparatory Academy.
Ownership History
Date
Name
Owned For
Owner Type
Purchase Details
Closed on
Jul 3, 2008
Sold by
Estate Of Carl Windell Hall
Bought by
Hall Wilma J
Current Estimated Value
Purchase Details
Closed on
Jul 2, 2008
Sold by
Hall Wilma J
Bought by
Cordle Carol J
Purchase Details
Closed on
May 26, 1966
Bought by
Hall Carl W and Hall Wilma J
Create a Home Valuation Report for This Property
The Home Valuation Report is an in-depth analysis detailing your home's value as well as a comparison with similar homes in the area
Home Values in the Area
Average Home Value in this Area
Purchase History
| Date | Buyer | Sale Price | Title Company |
|---|---|---|---|
| Hall Wilma J | -- | None Available | |
| Cordle Carol J | -- | None Available | |
| Hall Carl W | -- | -- |
Source: Public Records
Tax History
| Year | Tax Paid | Tax Assessment Tax Assessment Total Assessment is a certain percentage of the fair market value that is determined by local assessors to be the total taxable value of land and additions on the property. | Land | Improvement |
|---|---|---|---|---|
| 2025 | $2,368 | $51,670 | $19,430 | $32,240 |
| 2024 | $2,368 | $51,670 | $19,430 | $32,240 |
| 2023 | $2,488 | $51,660 | $19,425 | $32,235 |
| 2022 | $1,066 | $20,060 | $4,310 | $15,750 |
| 2021 | $1,068 | $20,060 | $4,310 | $15,750 |
| 2020 | $1,070 | $20,060 | $4,310 | $15,750 |
| 2019 | $1,004 | $16,140 | $3,610 | $12,530 |
| 2018 | $894 | $16,140 | $3,610 | $12,530 |
| 2017 | $1,003 | $16,140 | $3,610 | $12,530 |
| 2016 | $863 | $12,710 | $3,080 | $9,630 |
| 2015 | $786 | $12,710 | $3,080 | $9,630 |
| 2014 | $788 | $12,710 | $3,080 | $9,630 |
| 2013 | $409 | $13,370 | $3,255 | $10,115 |
Source: Public Records
Map
Nearby Homes
- 464 E Hinman Ave
- 472 E Hinman Ave
- 1692 Parsons Ave
- 1696 Parsons Ave
- 495 E Welch Ave
- 457 E Woodrow Ave Unit 459
- 1657 Ann St
- 379 E Morrill Ave
- 332 E Hinman Ave
- 380 E Markison Ave
- 1624 S 8th St
- 513 E Jenkins Ave
- 601 Southwood Ave
- 605 Southwood Ave
- 69 E Woodrow Ave
- 284-286 E Markison Ave
- 610 Southwood Ave
- 301 Southwood Ave
- 236 E Welch Ave
- 423 Sheldon Ave
- 488 E Hinman Ave
- 480 E Hinman Ave
- 476 E Hinman Ave
- 494 E Hinman Ave
- 500 E Hinman Ave
- 468 E Hinman Ave
- 487 E Morril Ave
- 483 E Morril Ave
- 489 E Morrill Ave Unit 491
- 483 E Morrill Ave
- 506 E Hinman Ave
- 493 E Morrill Ave Unit 495
- 481 E Morrill Ave
- 497-499 E Morrill Ave
- 497 E Morrill Ave Unit 499
- 462 E Hinman Ave
- 507 E Morrill Ave
- 501-503 E Morrill Ave
- 477 E Morrill Ave
- 501 E Morrill Ave Unit 503
Your Personal Tour Guide
Ask me questions while you tour the home.