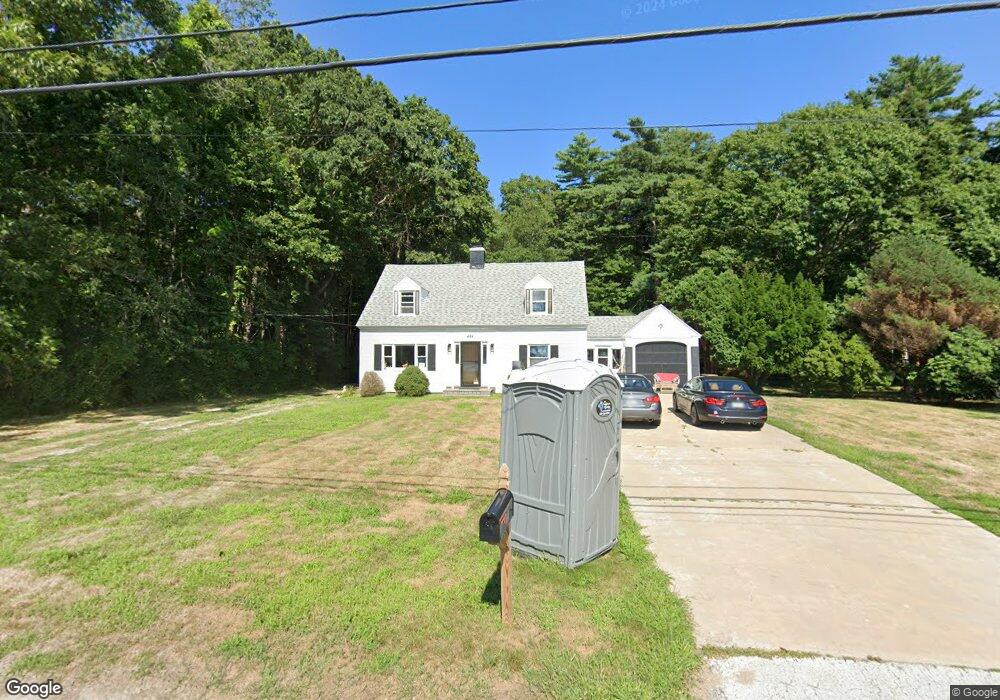
484 Ferry Rd Saco, ME 04072
Ferry Beach NeighborhoodEstimated Value: $657,000 - $790,000
2
Beds
2
Baths
1,961
Sq Ft
$365/Sq Ft
Est. Value
About This Home
This home is located at 484 Ferry Rd, Saco, ME 04072 and is currently estimated at $715,742, approximately $364 per square foot. 484 Ferry Rd is a home located in York County with nearby schools including C K Burns School, Saco Middle School, and Florence Lombard Christian School.
Ownership History
Date
Name
Owned For
Owner Type
Purchase Details
Closed on
Feb 24, 2023
Sold by
Aaron G R G and Aaron Chona M
Bought by
Thurston Lisa M and Thurston Garrett S
Current Estimated Value
Home Financials for this Owner
Home Financials are based on the most recent Mortgage that was taken out on this home.
Original Mortgage
$400,000
Outstanding Balance
$386,127
Interest Rate
6.15%
Mortgage Type
Purchase Money Mortgage
Estimated Equity
$329,615
Create a Home Valuation Report for This Property
The Home Valuation Report is an in-depth analysis detailing your home's value as well as a comparison with similar homes in the area
Home Values in the Area
Average Home Value in this Area
Purchase History
| Date | Buyer | Sale Price | Title Company |
|---|---|---|---|
| Thurston Lisa M | $730,000 | None Available |
Source: Public Records
Mortgage History
| Date | Status | Borrower | Loan Amount |
|---|---|---|---|
| Open | Thurston Lisa M | $400,000 |
Source: Public Records
Tax History
| Year | Tax Paid | Tax Assessment Tax Assessment Total Assessment is a certain percentage of the fair market value that is determined by local assessors to be the total taxable value of land and additions on the property. | Land | Improvement |
|---|---|---|---|---|
| 2024 | $5,258 | $374,200 | $168,100 | $206,100 |
| 2023 | $5,154 | $349,400 | $168,100 | $181,300 |
| 2022 | $4,260 | $232,400 | $127,600 | $104,800 |
| 2021 | $4,082 | $216,200 | $115,700 | $100,500 |
| 2020 | $3,853 | $195,900 | $103,900 | $92,000 |
| 2019 | $3,797 | $195,900 | $103,900 | $92,000 |
| 2018 | $820 | $191,900 | $99,900 | $92,000 |
| 2017 | $3,421 | $176,500 | $90,800 | $85,700 |
| 2016 | $3,870 | $199,300 | $87,200 | $112,100 |
| 2015 | $3,804 | $197,900 | $87,200 | $110,700 |
| 2014 | $3,685 | $197,900 | $87,200 | $110,700 |
| 2013 | $3,677 | $197,900 | $87,200 | $110,700 |
Source: Public Records
Map
Nearby Homes
- 46 Ferry Ln
- 3 Walker Dr Unit 101
- 4 Walker Dr Unit 101
- 3 Walker Dr Unit 101
- TBD 530 Ferry Rd
- 10 Lower Beach Rd
- 30 Vines Rd
- 650 Pool St
- 625 Pool St
- 1 Main Ave
- 295 Ferry Rd
- 280 Seaside Ave
- 9 Riverside Ave
- 378 Pool St
- 353 Pool St
- 74 Guinea Rd
- 343 Pool St
- 9 Windward Ridge
- 6 Decary Rd
- 11 Peabody Ln Unit 101
Your Personal Tour Guide
Ask me questions while you tour the home.