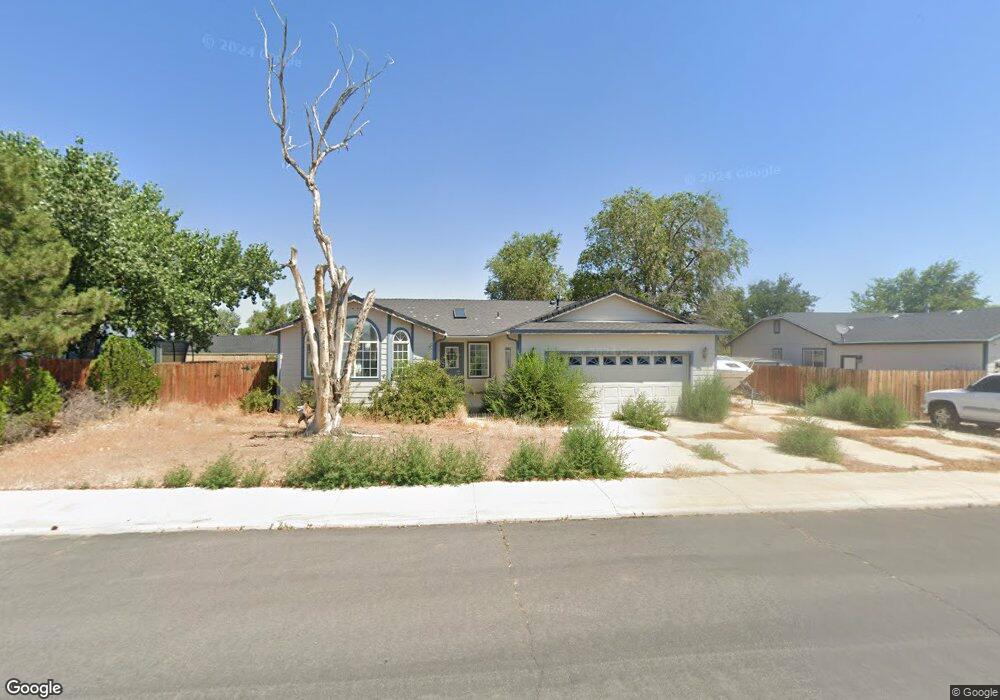
484 Nader Way Unit 2 Fernley, NV 89408
Estimated Value: $371,000 - $410,000
3
Beds
2
Baths
1,639
Sq Ft
$235/Sq Ft
Est. Value
About This Home
This home is located at 484 Nader Way Unit 2, Fernley, NV 89408 and is currently estimated at $385,374, approximately $235 per square foot. 484 Nader Way Unit 2 is a home located in Lyon County with nearby schools including Fernley Elementary School, Fernley Intermediate School, and Fernley High School.
Ownership History
Date
Name
Owned For
Owner Type
Purchase Details
Closed on
Oct 14, 2010
Sold by
Bode Richard I and Bode Sandra S
Bought by
Loutas Dimitrios
Current Estimated Value
Purchase Details
Closed on
Aug 13, 2010
Sold by
Beglinger Donald R and Beglinger Margi Lyn
Bought by
Bode Richard I and Bode Sandra S
Purchase Details
Closed on
Jun 25, 2007
Sold by
Beglinger Donald Raymond and Beglinger Donald R
Bought by
Beglinger Donald R
Home Financials for this Owner
Home Financials are based on the most recent Mortgage that was taken out on this home.
Original Mortgage
$41,250
Interest Rate
6.21%
Mortgage Type
Stand Alone Second
Purchase Details
Closed on
Mar 3, 2006
Sold by
Beglinger Margi Lyn
Bought by
Beglinger Donald Raymond
Create a Home Valuation Report for This Property
The Home Valuation Report is an in-depth analysis detailing your home's value as well as a comparison with similar homes in the area
Home Values in the Area
Average Home Value in this Area
Purchase History
| Date | Buyer | Sale Price | Title Company |
|---|---|---|---|
| Loutas Dimitrios | $114,000 | Western Title Company | |
| Bode Richard I | $60,809 | First American Title | |
| Beglinger Donald R | -- | Title Service & Escrow Co | |
| Beglinger Donald Raymond | -- | Title Service & Escrow Co |
Source: Public Records
Mortgage History
| Date | Status | Borrower | Loan Amount |
|---|---|---|---|
| Previous Owner | Beglinger Donald R | $41,250 |
Source: Public Records
Tax History Compared to Growth
Tax History
| Year | Tax Paid | Tax Assessment Tax Assessment Total Assessment is a certain percentage of the fair market value that is determined by local assessors to be the total taxable value of land and additions on the property. | Land | Improvement |
|---|---|---|---|---|
| 2025 | $1,507 | $105,664 | $49,000 | $56,664 |
| 2024 | $1,873 | $106,201 | $49,000 | $57,201 |
| 2023 | $1,873 | $102,658 | $49,000 | $53,658 |
| 2022 | $1,764 | $98,781 | $49,000 | $49,781 |
| 2021 | $1,750 | $94,146 | $45,500 | $48,646 |
| 2020 | $1,706 | $83,253 | $36,750 | $46,503 |
| 2019 | $1,684 | $74,669 | $29,750 | $44,919 |
| 2018 | $1,651 | $68,419 | $24,500 | $43,919 |
| 2017 | $1,648 | $61,500 | $17,500 | $44,000 |
| 2016 | $1,461 | $48,735 | $5,780 | $42,955 |
| 2015 | $1,496 | $37,151 | $5,780 | $31,371 |
| 2014 | $1,463 | $32,110 | $5,780 | $26,330 |
Source: Public Records
Map
Nearby Homes